Palm Beach County, Florida Nativity & Citizenship Status (2024)
Place of birth and citizenship status analysis for Palm Beach County, Florida
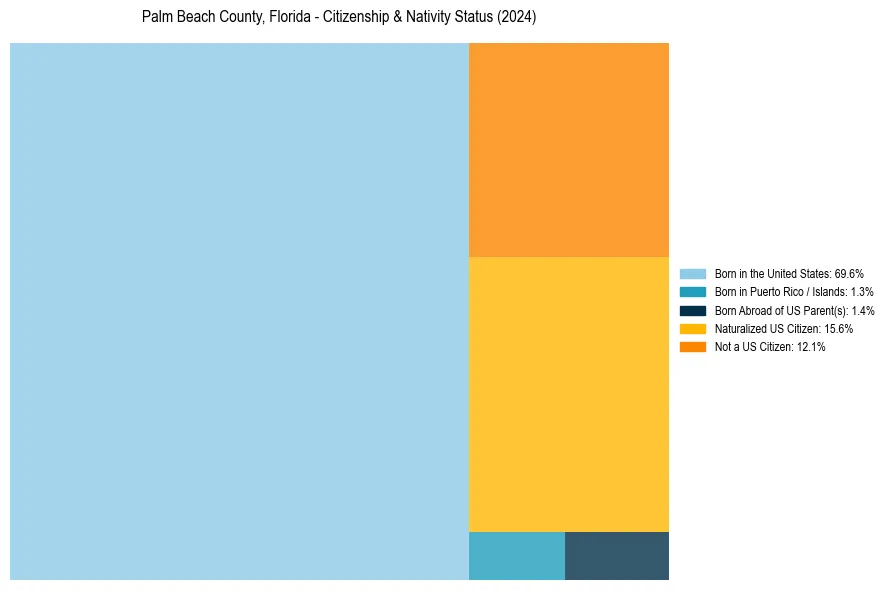
Palm Beach County, Florida Nativity & Citizenship Indicators (2024)
Native Born
72.3%
Foreign Born
27.7%
Naturalized
15.6%
US Citizens
87.9%
Palm Beach County, Florida Nativity & Citizenship Distribution
Palm Beach County, Florida Historical Nativity Trends (2010–2024)
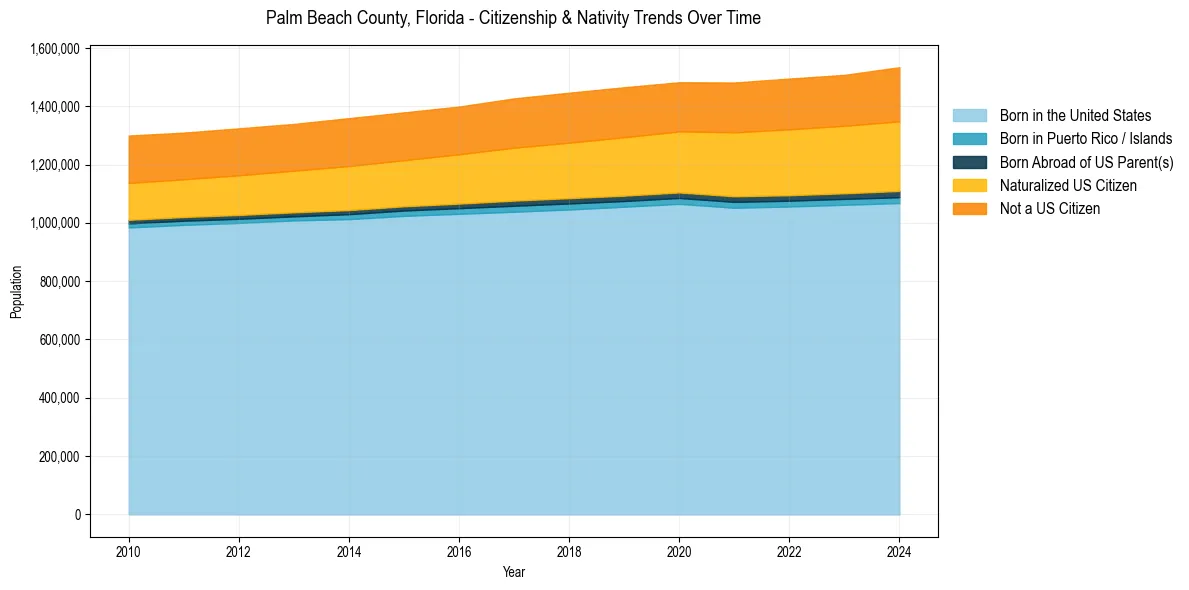
Palm Beach County, Florida Population & Nativity History
| Year | Total Pop | Foreign Born | Native Born |
|---|---|---|---|
| 2024 | 1,533,806 | 27.7% | 72.3% |
| 2023 | 1,507,453 | 26.9% | 73.1% |
| 2022 | 1,494,805 | 26.8% | 73.2% |
| 2021 | 1,481,233 | 26.3% | 73.7% |
| 2020 | 1,482,057 | 25.5% | 74.5% |
| 2019 | 1,465,027 | 25.4% | 74.6% |
| 2018 | 1,446,277 | 25.0% | 75.0% |
| 2017 | 1,426,772 | 24.6% | 75.4% |
| 2016 | 1,398,757 | 23.8% | 76.2% |
| 2015 | 1,378,806 | 23.4% | 76.6% |
| 2014 | 1,359,074 | 23.2% | 76.8% |
| 2013 | 1,339,221 | 22.6% | 77.4% |
| 2012 | 1,324,085 | 22.4% | 77.6% |
| 2011 | 1,309,401 | 22.1% | 77.9% |
| 2010 | 1,299,356 | 22.3% | 77.7% |
Nativity & Citizenship FAQs for Palm Beach County, Florida
Approximately 27.7% of residents in Palm Beach County, Florida were born outside the United States.
The vast majority of residents, roughly 87.9%, are U.S. citizens (including both native-born and naturalized citizens).