Pasco County, Florida Nativity & Citizenship Status (2024)
Place of birth and citizenship status analysis for Pasco County, Florida
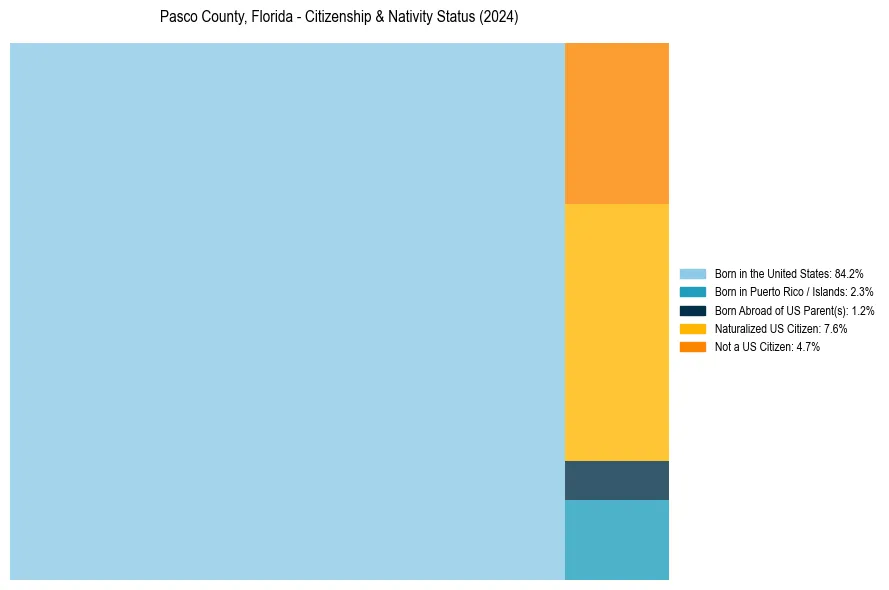
Pasco County, Florida Nativity & Citizenship Indicators (2024)
Native Born
87.7%
Foreign Born
12.3%
Naturalized
7.6%
US Citizens
95.3%
Pasco County, Florida Nativity & Citizenship Distribution
Pasco County, Florida Historical Nativity Trends (2010–2024)
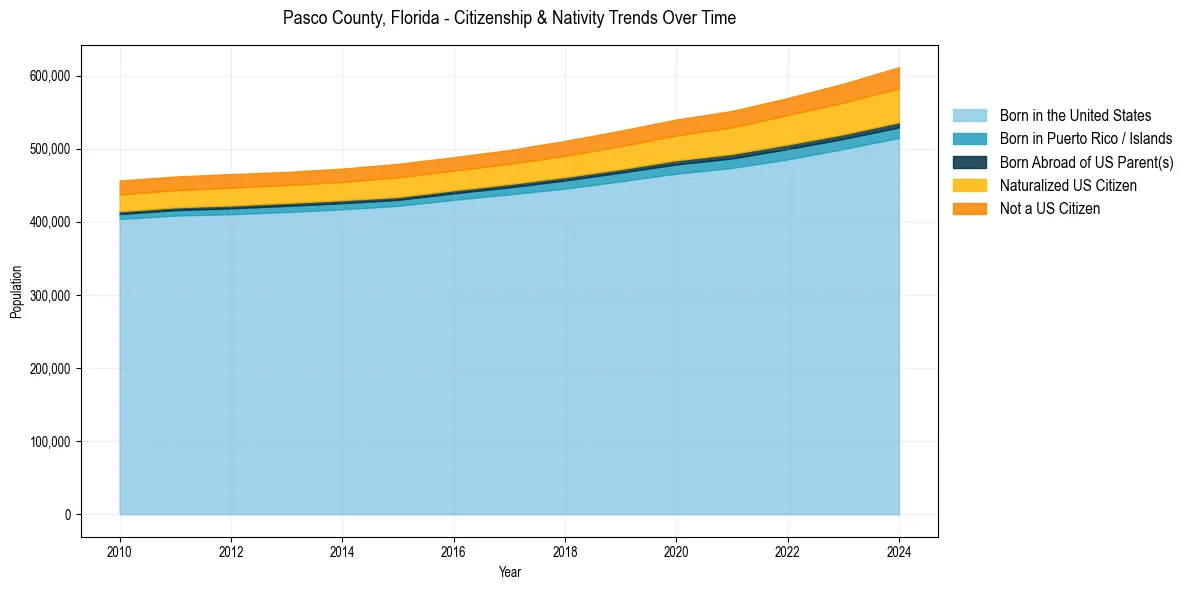
Pasco County, Florida Population & Nativity History
| Year | Total Pop | Foreign Born | Native Born |
|---|---|---|---|
| 2024 | 611,444 | 12.3% | 87.7% |
| 2023 | 588,758 | 11.7% | 88.3% |
| 2022 | 569,211 | 11.1% | 88.9% |
| 2021 | 551,598 | 10.7% | 89.3% |
| 2020 | 539,885 | 10.3% | 89.7% |
| 2019 | 524,602 | 10.0% | 90.0% |
| 2018 | 510,593 | 9.7% | 90.3% |
| 2017 | 498,136 | 9.3% | 90.7% |
| 2016 | 488,310 | 9.2% | 90.8% |
| 2015 | 479,288 | 9.4% | 90.6% |
| 2014 | 472,745 | 9.1% | 90.9% |
| 2013 | 468,194 | 9.0% | 91.0% |
| 2012 | 465,276 | 9.2% | 90.8% |
| 2011 | 461,898 | 9.1% | 90.9% |
| 2010 | 456,514 | 9.2% | 90.8% |
Nativity & Citizenship FAQs for Pasco County, Florida
Approximately 12.3% of residents in Pasco County, Florida were born outside the United States.
The vast majority of residents, roughly 95.3%, are U.S. citizens (including both native-born and naturalized citizens).