Pinellas County, Florida Nativity & Citizenship Status (2024)
Place of birth and citizenship status analysis for Pinellas County, Florida
Pinellas County, Florida Nativity & Citizenship Indicators (2024)
Native Born
87.6%
Foreign Born
12.4%
Naturalized
8.2%
US Citizens
95.8%
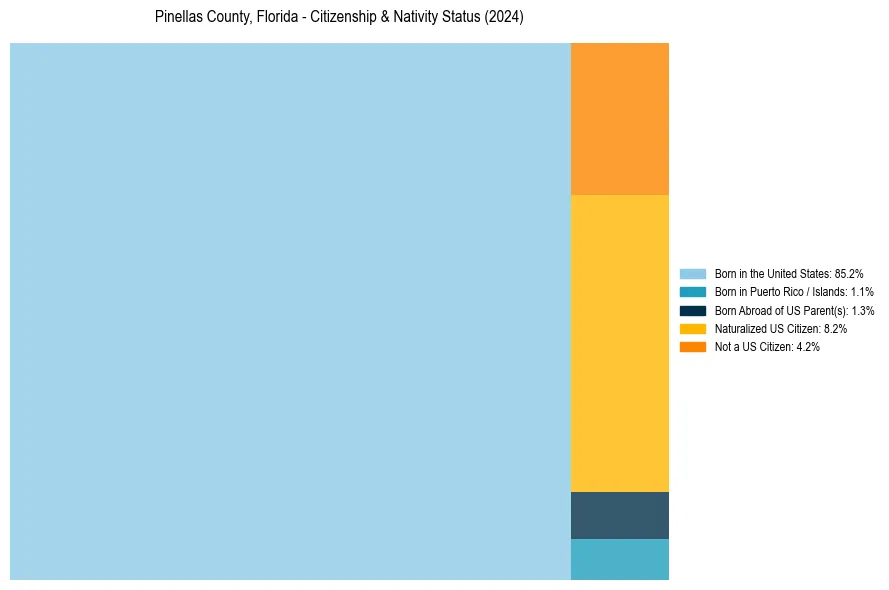
Pinellas County, Florida Nativity & Citizenship Distribution
Pinellas County, Florida Historical Nativity Trends (2010–2024)
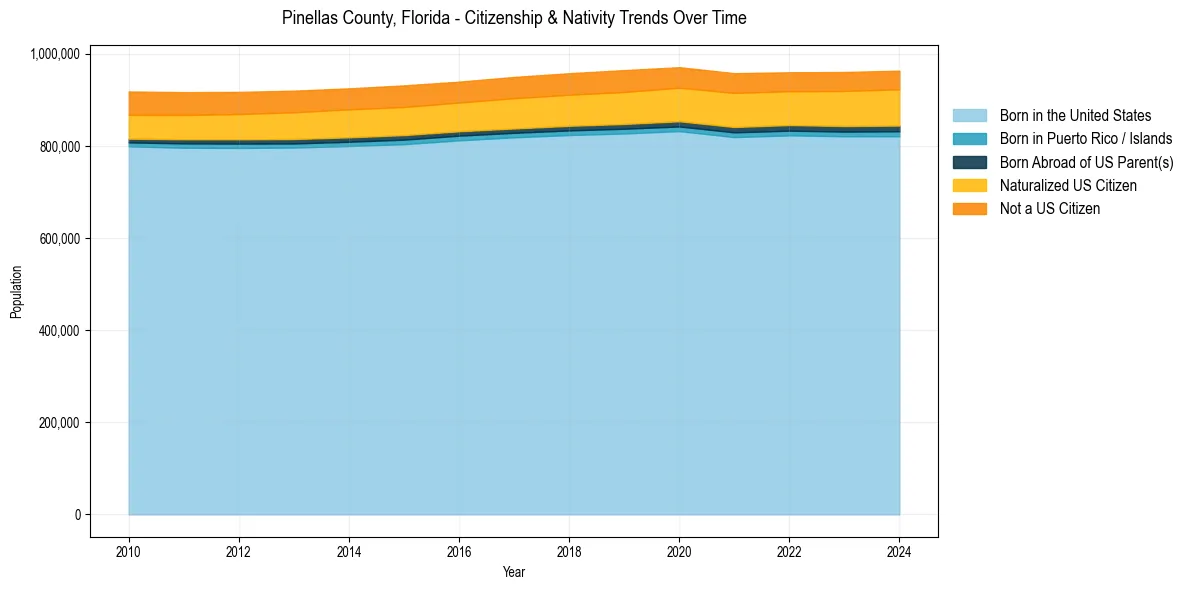
Pinellas County, Florida Population & Nativity History
| Year | Total Pop | Foreign Born | Native Born |
|---|---|---|---|
| 2024 | 963,481 | 12.4% | 87.6% |
| 2023 | 960,565 | 12.2% | 87.8% |
| 2022 | 959,918 | 11.9% | 88.1% |
| 2021 | 957,989 | 12.2% | 87.8% |
| 2020 | 970,985 | 12.1% | 87.9% |
| 2019 | 964,666 | 12.1% | 87.9% |
| 2018 | 957,875 | 11.9% | 88.1% |
| 2017 | 949,842 | 11.8% | 88.2% |
| 2016 | 939,548 | 11.5% | 88.5% |
| 2015 | 931,477 | 11.6% | 88.4% |
| 2014 | 925,030 | 11.5% | 88.5% |
| 2013 | 920,015 | 11.4% | 88.6% |
| 2012 | 917,389 | 11.2% | 88.8% |
| 2011 | 916,806 | 11.2% | 88.8% |
| 2010 | 918,263 | 11.2% | 88.8% |
Nativity & Citizenship FAQs for Pinellas County, Florida
Approximately 12.4% of residents in Pinellas County, Florida were born outside the United States.
The vast majority of residents, roughly 95.8%, are U.S. citizens (including both native-born and naturalized citizens).