St. Johns County, Florida Nativity & Citizenship Status (2024)
Place of birth and citizenship status analysis for St. Johns County, Florida
St. Johns County, Florida Nativity & Citizenship Indicators (2024)
Native Born
90.6%
Foreign Born
9.4%
Naturalized
6.2%
US Citizens
96.7%
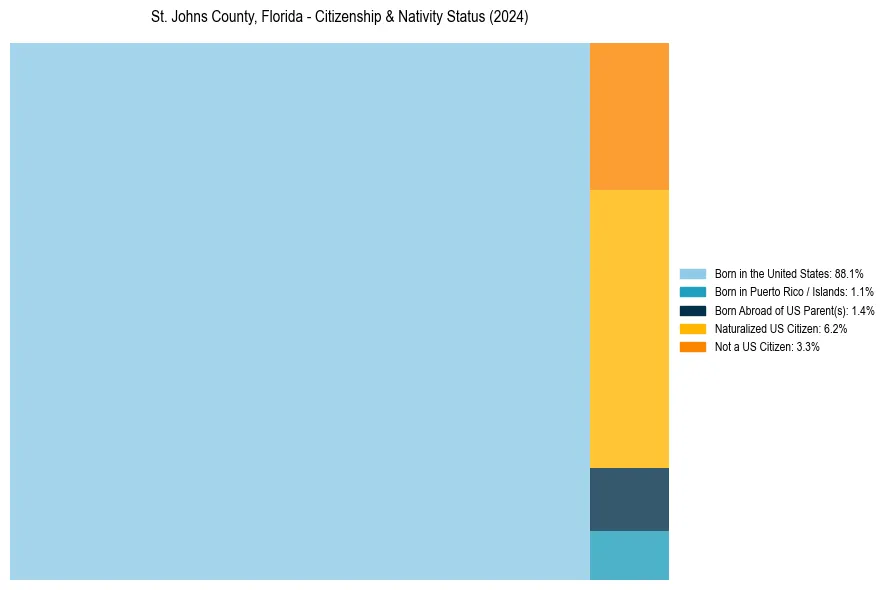
St. Johns County, Florida Nativity & Citizenship Distribution
St. Johns County, Florida Historical Nativity Trends (2010–2024)
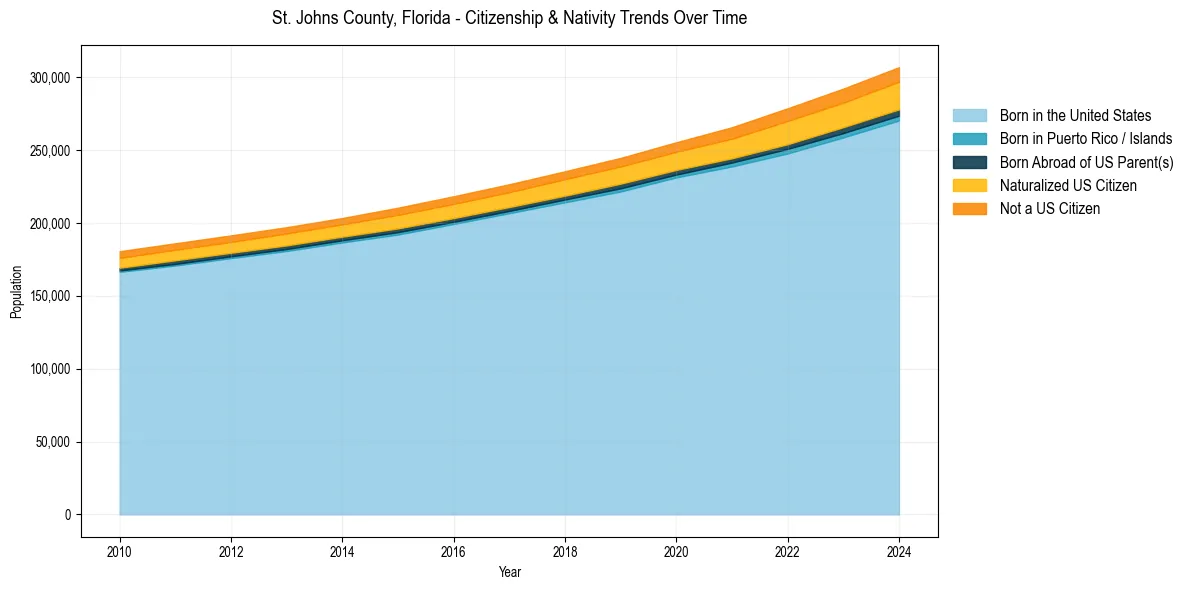
St. Johns County, Florida Population & Nativity History
| Year | Total Pop | Foreign Born | Native Born |
|---|---|---|---|
| 2024 | 306,934 | 9.4% | 90.6% |
| 2023 | 292,243 | 9.1% | 90.9% |
| 2022 | 278,722 | 8.9% | 91.1% |
| 2021 | 265,724 | 8.0% | 92.0% |
| 2020 | 255,410 | 7.4% | 92.6% |
| 2019 | 244,674 | 7.2% | 92.8% |
| 2018 | 235,503 | 7.1% | 92.9% |
| 2017 | 226,578 | 6.9% | 93.1% |
| 2016 | 218,362 | 6.9% | 93.1% |
| 2015 | 210,495 | 6.8% | 93.2% |
| 2014 | 203,402 | 6.3% | 93.7% |
| 2013 | 197,115 | 6.4% | 93.6% |
| 2012 | 191,495 | 6.2% | 93.8% |
| 2011 | 186,077 | 6.3% | 93.7% |
| 2010 | 180,624 | 6.3% | 93.7% |
Nativity & Citizenship FAQs for St. Johns County, Florida
Approximately 9.4% of residents in St. Johns County, Florida were born outside the United States.
The vast majority of residents, roughly 96.7%, are U.S. citizens (including both native-born and naturalized citizens).