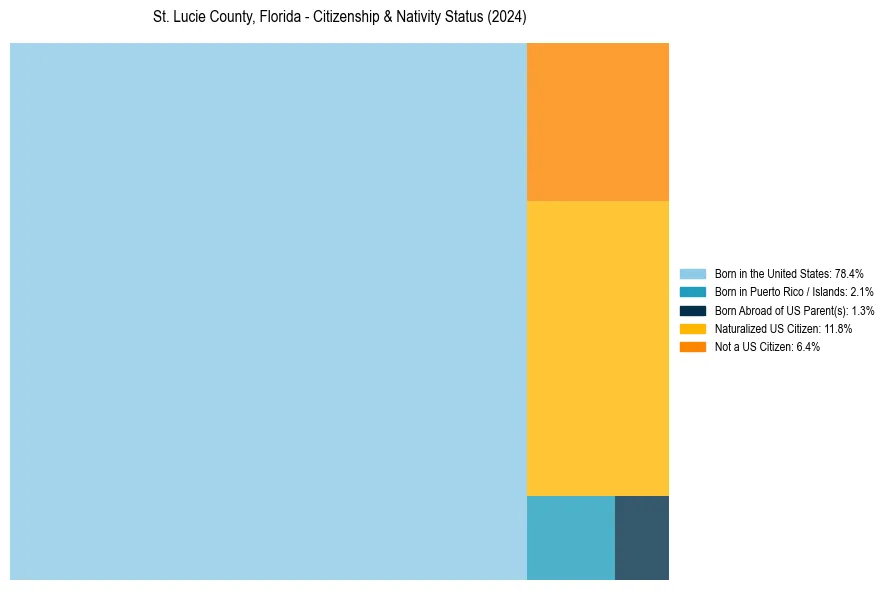
St. Lucie County, Florida Nativity & Citizenship Status (2024)
Place of birth and citizenship status analysis for St. Lucie County, Florida
St. Lucie County, Florida Nativity & Citizenship Indicators (2024)
Native Born
81.8%
Foreign Born
18.2%
Naturalized
11.8%
US Citizens
93.6%
St. Lucie County, Florida Nativity & Citizenship Distribution
St. Lucie County, Florida Historical Nativity Trends (2010–2024)
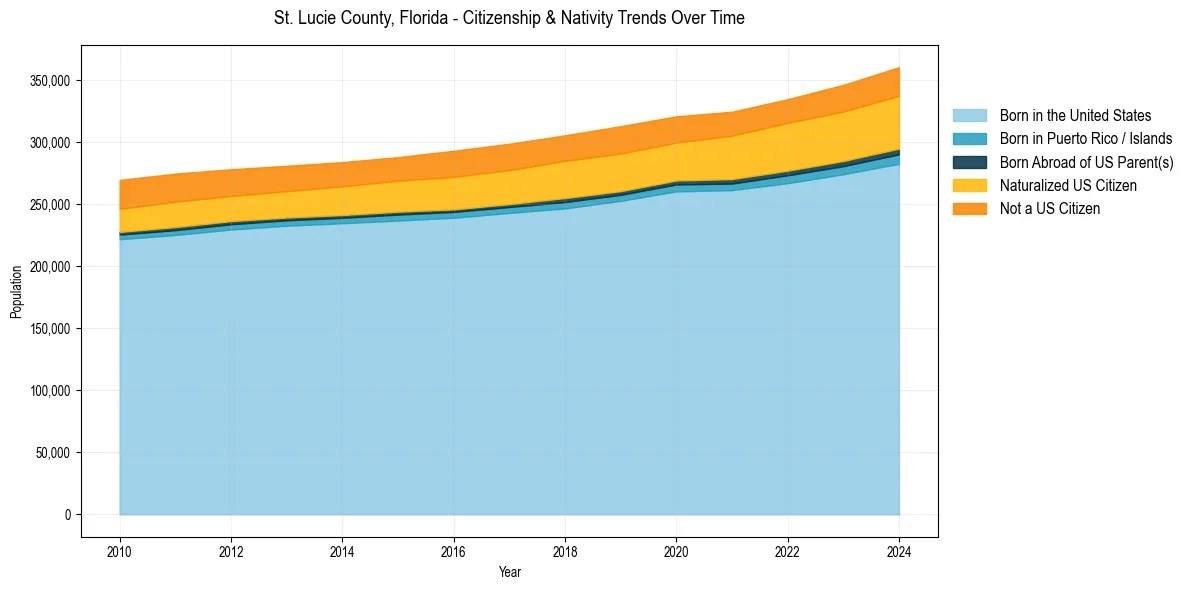
St. Lucie County, Florida Population & Nativity History
| Year | Total Pop | Foreign Born | Native Born |
|---|---|---|---|
| 2024 | 360,500 | 18.2% | 81.8% |
| 2023 | 346,237 | 17.7% | 82.3% |
| 2022 | 334,682 | 17.2% | 82.8% |
| 2021 | 324,599 | 16.7% | 83.3% |
| 2020 | 320,914 | 16.1% | 83.9% |
| 2019 | 312,947 | 16.8% | 83.2% |
| 2018 | 305,591 | 16.6% | 83.4% |
| 2017 | 298,763 | 16.3% | 83.7% |
| 2016 | 293,136 | 16.1% | 83.9% |
| 2015 | 288,006 | 15.3% | 84.7% |
| 2014 | 283,988 | 15.0% | 85.0% |
| 2013 | 281,015 | 14.9% | 85.1% |
| 2012 | 278,246 | 15.0% | 85.0% |
| 2011 | 274,693 | 15.7% | 84.3% |
| 2010 | 269,659 | 15.6% | 84.4% |
Nativity & Citizenship FAQs for St. Lucie County, Florida
Approximately 18.2% of residents in St. Lucie County, Florida were born outside the United States.
The vast majority of residents, roughly 93.6%, are U.S. citizens (including both native-born and naturalized citizens).