Baldwin County, Georgia Nativity & Citizenship Status (2024)
Place of birth and citizenship status analysis for Baldwin County, Georgia
Baldwin County, Georgia Nativity & Citizenship Indicators (2024)
Native Born
96.7%
Foreign Born
3.3%
Naturalized
1.6%
US Citizens
98.3%
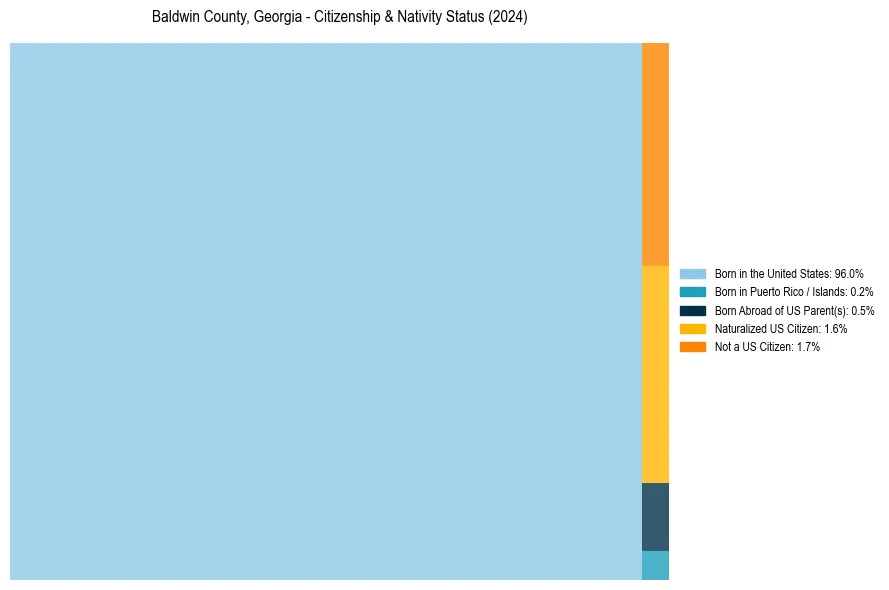
Baldwin County, Georgia Nativity & Citizenship Distribution
Baldwin County, Georgia Historical Nativity Trends (2010–2024)
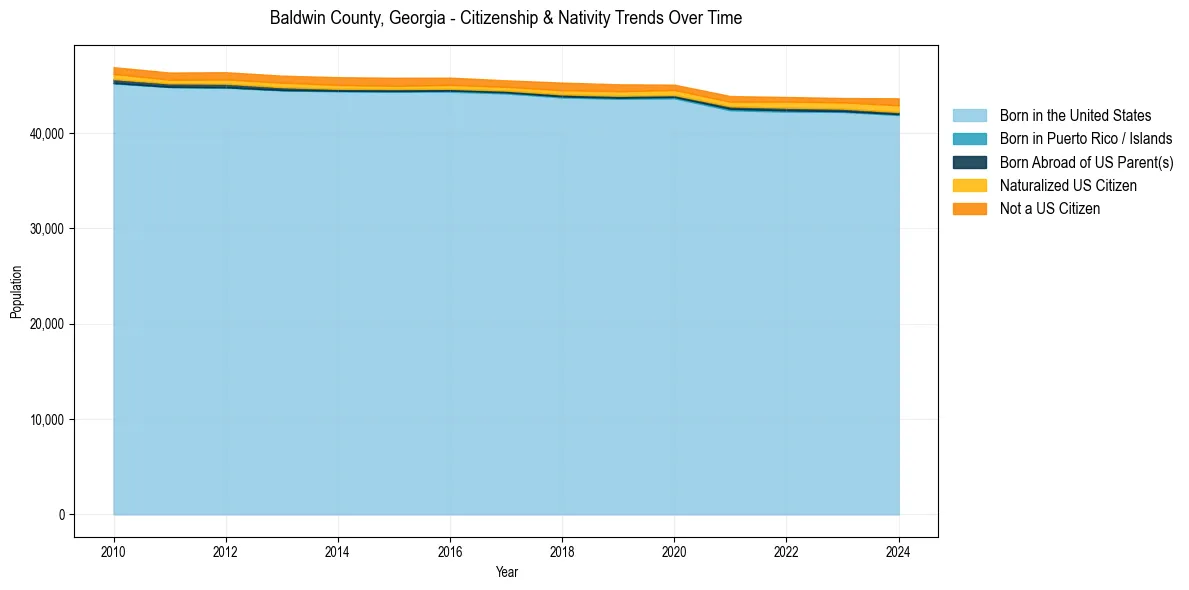
Baldwin County, Georgia Population & Nativity History
| Year | Total Pop | Foreign Born | Native Born |
|---|---|---|---|
| 2024 | 43,642 | 3.3% | 96.7% |
| 2023 | 43,669 | 2.6% | 97.4% |
| 2022 | 43,778 | 2.6% | 97.4% |
| 2021 | 43,876 | 2.5% | 97.5% |
| 2020 | 45,072 | 2.4% | 97.6% |
| 2019 | 45,111 | 2.7% | 97.3% |
| 2018 | 45,286 | 2.7% | 97.3% |
| 2017 | 45,527 | 2.4% | 97.6% |
| 2016 | 45,808 | 2.6% | 97.4% |
| 2015 | 45,795 | 2.6% | 97.4% |
| 2014 | 45,854 | 2.7% | 97.3% |
| 2013 | 46,018 | 2.6% | 97.4% |
| 2012 | 46,378 | 2.6% | 97.4% |
| 2011 | 46,345 | 2.5% | 97.5% |
| 2010 | 46,905 | 2.7% | 97.3% |
Nativity & Citizenship FAQs for Baldwin County, Georgia
Approximately 3.3% of residents in Baldwin County, Georgia were born outside the United States.
The vast majority of residents, roughly 98.3%, are U.S. citizens (including both native-born and naturalized citizens).