Bryan County, Georgia Nativity & Citizenship Status (2024)
Place of birth and citizenship status analysis for Bryan County, Georgia
Bryan County, Georgia Nativity & Citizenship Indicators (2024)
Native Born
93.7%
Foreign Born
6.3%
Naturalized
4.6%
US Citizens
98.3%
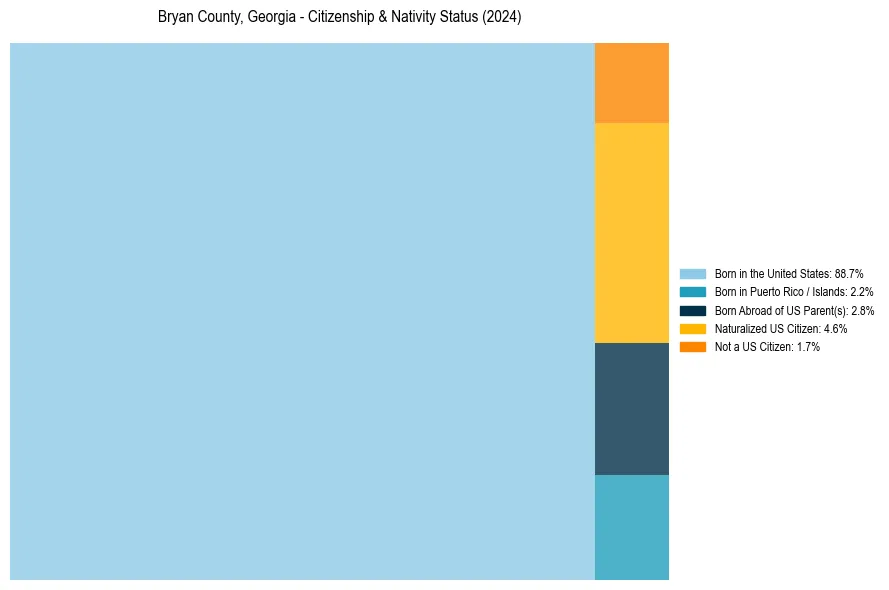
Bryan County, Georgia Nativity & Citizenship Distribution
Bryan County, Georgia Historical Nativity Trends (2010–2024)
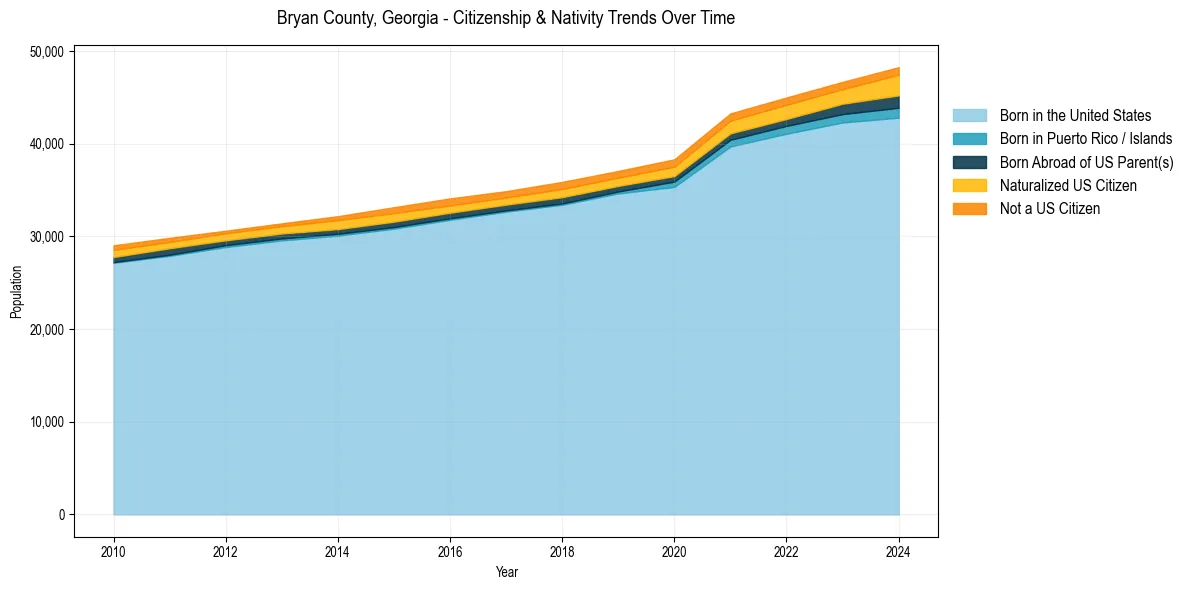
Bryan County, Georgia Population & Nativity History
| Year | Total Pop | Foreign Born | Native Born |
|---|---|---|---|
| 2024 | 48,263 | 6.3% | 93.7% |
| 2023 | 46,681 | 5.1% | 94.9% |
| 2022 | 44,995 | 5.2% | 94.8% |
| 2021 | 43,278 | 5.0% | 95.0% |
| 2020 | 38,321 | 4.7% | 95.3% |
| 2019 | 37,063 | 4.4% | 95.6% |
| 2018 | 35,885 | 4.6% | 95.4% |
| 2017 | 34,883 | 4.2% | 95.8% |
| 2016 | 34,104 | 4.5% | 95.5% |
| 2015 | 33,151 | 4.7% | 95.3% |
| 2014 | 32,185 | 4.3% | 95.7% |
| 2013 | 31,410 | 3.5% | 96.5% |
| 2012 | 30,616 | 3.4% | 96.6% |
| 2011 | 29,847 | 3.8% | 96.2% |
| 2010 | 29,039 | 4.4% | 95.6% |
Nativity & Citizenship FAQs for Bryan County, Georgia
Approximately 6.3% of residents in Bryan County, Georgia were born outside the United States.
The vast majority of residents, roughly 98.3%, are U.S. citizens (including both native-born and naturalized citizens).