Butts County, Georgia Nativity & Citizenship Status (2024)
Place of birth and citizenship status analysis for Butts County, Georgia
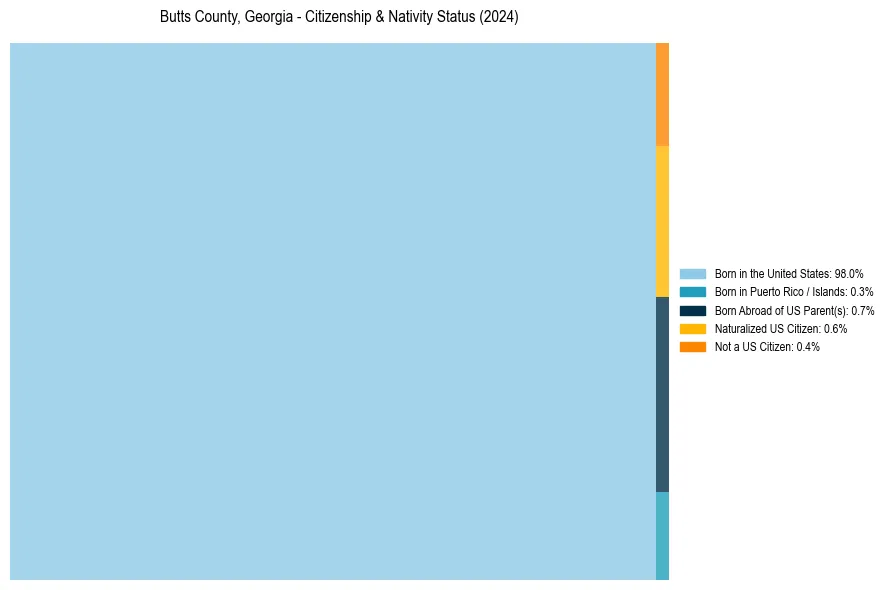
Butts County, Georgia Nativity & Citizenship Indicators (2024)
Native Born
99.1%
Foreign Born
0.9%
Naturalized
0.6%
US Citizens
99.6%
Butts County, Georgia Nativity & Citizenship Distribution
Butts County, Georgia Historical Nativity Trends (2010–2024)
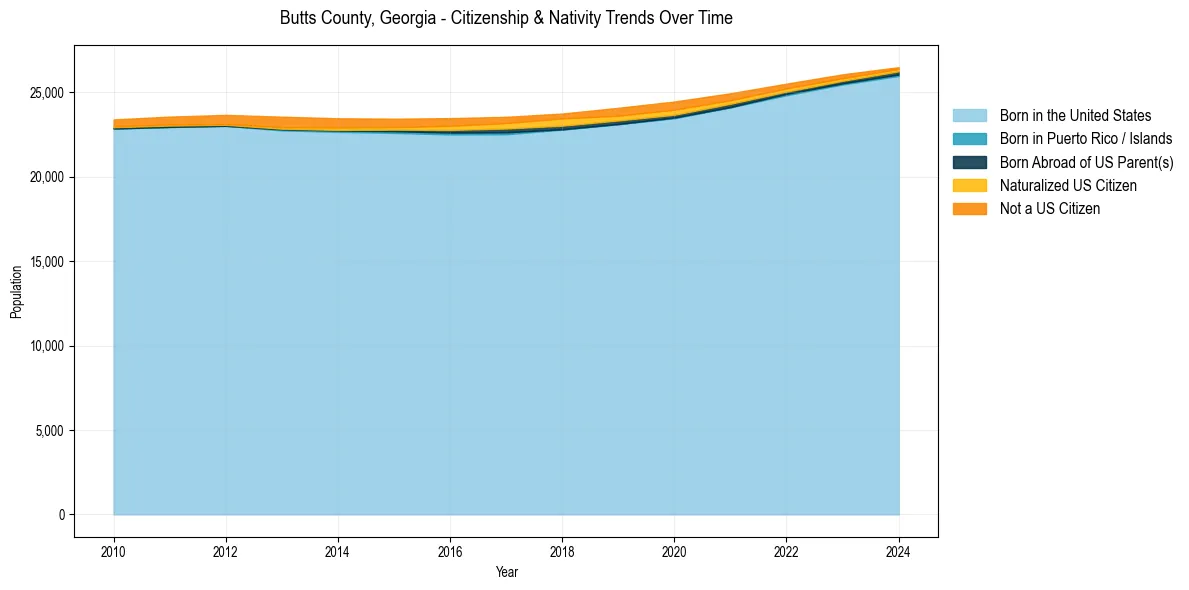
Butts County, Georgia Population & Nativity History
| Year | Total Pop | Foreign Born | Native Born |
|---|---|---|---|
| 2024 | 26,496 | 0.9% | 99.1% |
| 2023 | 26,074 | 1.5% | 98.5% |
| 2022 | 25,522 | 1.9% | 98.1% |
| 2021 | 24,950 | 2.5% | 97.5% |
| 2020 | 24,463 | 3.2% | 96.8% |
| 2019 | 24,090 | 3.1% | 96.9% |
| 2018 | 23,750 | 3.0% | 97.0% |
| 2017 | 23,556 | 2.9% | 97.1% |
| 2016 | 23,479 | 3.0% | 97.0% |
| 2015 | 23,445 | 2.8% | 97.2% |
| 2014 | 23,469 | 2.9% | 97.1% |
| 2013 | 23,563 | 3.0% | 97.0% |
| 2012 | 23,671 | 2.5% | 97.5% |
| 2011 | 23,568 | 2.3% | 97.7% |
| 2010 | 23,401 | 2.0% | 98.0% |
Nativity & Citizenship FAQs for Butts County, Georgia
Approximately 0.9% of residents in Butts County, Georgia were born outside the United States.
The vast majority of residents, roughly 99.6%, are U.S. citizens (including both native-born and naturalized citizens).