Carroll County, Georgia Nativity & Citizenship Status (2024)
Place of birth and citizenship status analysis for Carroll County, Georgia
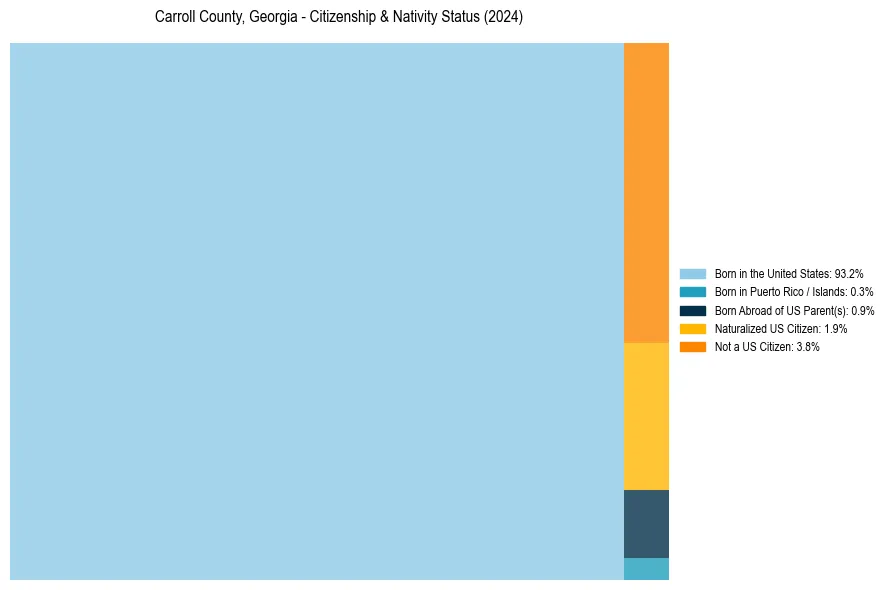
Carroll County, Georgia Nativity & Citizenship Indicators (2024)
Native Born
94.3%
Foreign Born
5.7%
Naturalized
1.9%
US Citizens
96.2%
Carroll County, Georgia Nativity & Citizenship Distribution
Carroll County, Georgia Historical Nativity Trends (2010–2024)
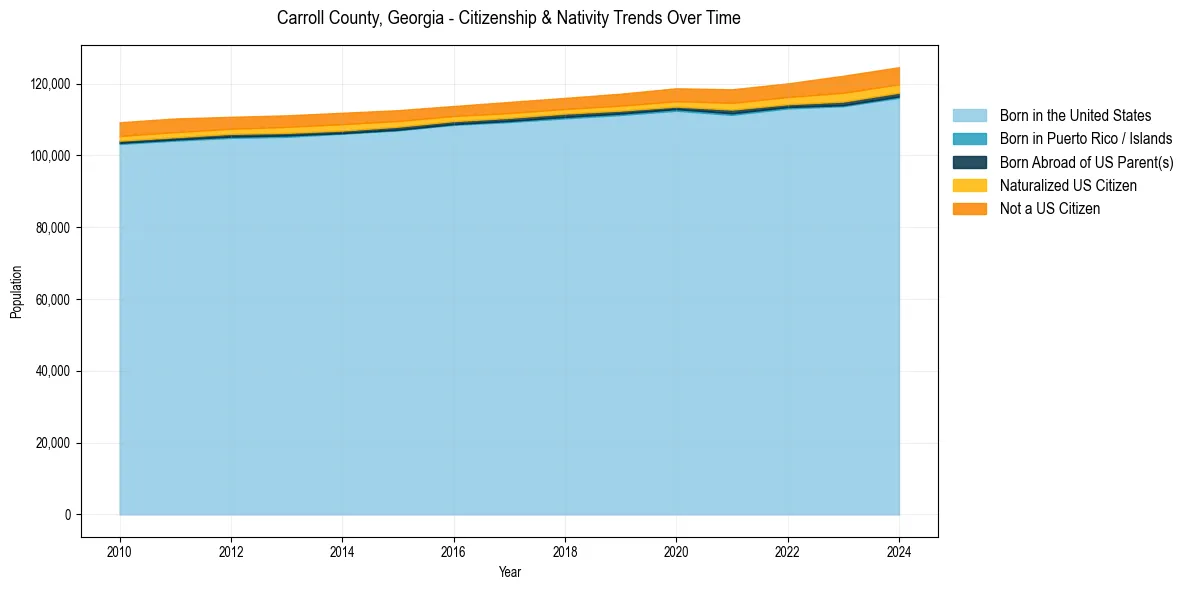
Carroll County, Georgia Population & Nativity History
| Year | Total Pop | Foreign Born | Native Born |
|---|---|---|---|
| 2024 | 124,569 | 5.7% | 94.3% |
| 2023 | 122,187 | 5.9% | 94.1% |
| 2022 | 120,060 | 4.8% | 95.2% |
| 2021 | 118,402 | 4.8% | 95.2% |
| 2020 | 118,692 | 4.3% | 95.7% |
| 2019 | 117,183 | 4.0% | 96.0% |
| 2018 | 116,022 | 3.8% | 96.2% |
| 2017 | 114,898 | 3.9% | 96.1% |
| 2016 | 113,756 | 3.7% | 96.3% |
| 2015 | 112,595 | 4.1% | 95.9% |
| 2014 | 111,872 | 4.4% | 95.6% |
| 2013 | 111,160 | 4.4% | 95.6% |
| 2012 | 110,750 | 4.3% | 95.7% |
| 2011 | 110,292 | 4.8% | 95.2% |
| 2010 | 109,227 | 4.7% | 95.3% |
Nativity & Citizenship FAQs for Carroll County, Georgia
Approximately 5.7% of residents in Carroll County, Georgia were born outside the United States.
The vast majority of residents, roughly 96.2%, are U.S. citizens (including both native-born and naturalized citizens).