Chatham County, Georgia Nativity & Citizenship Status (2024)
Place of birth and citizenship status analysis for Chatham County, Georgia
Chatham County, Georgia Nativity & Citizenship Indicators (2024)
Native Born
91.3%
Foreign Born
8.7%
Naturalized
4.1%
US Citizens
95.3%
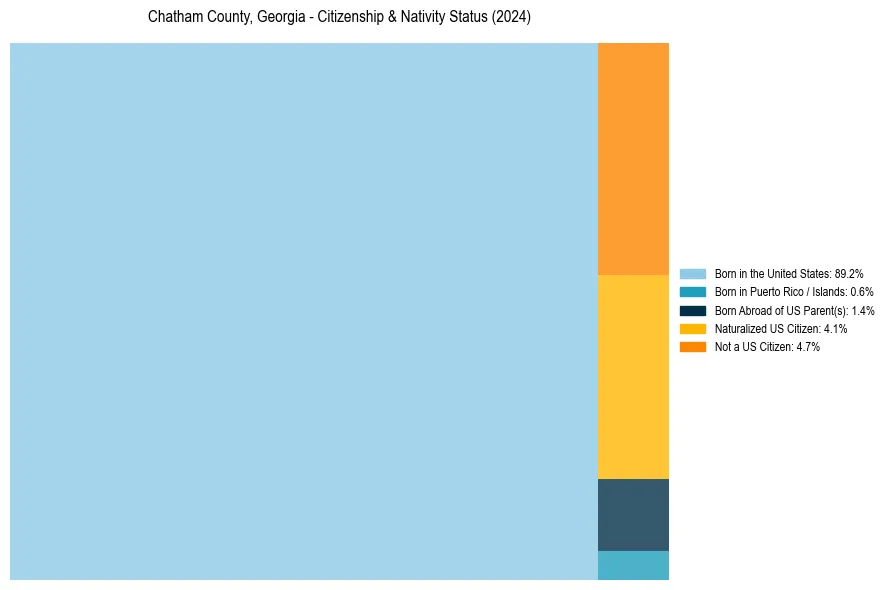
Chatham County, Georgia Nativity & Citizenship Distribution
Chatham County, Georgia Historical Nativity Trends (2010–2024)
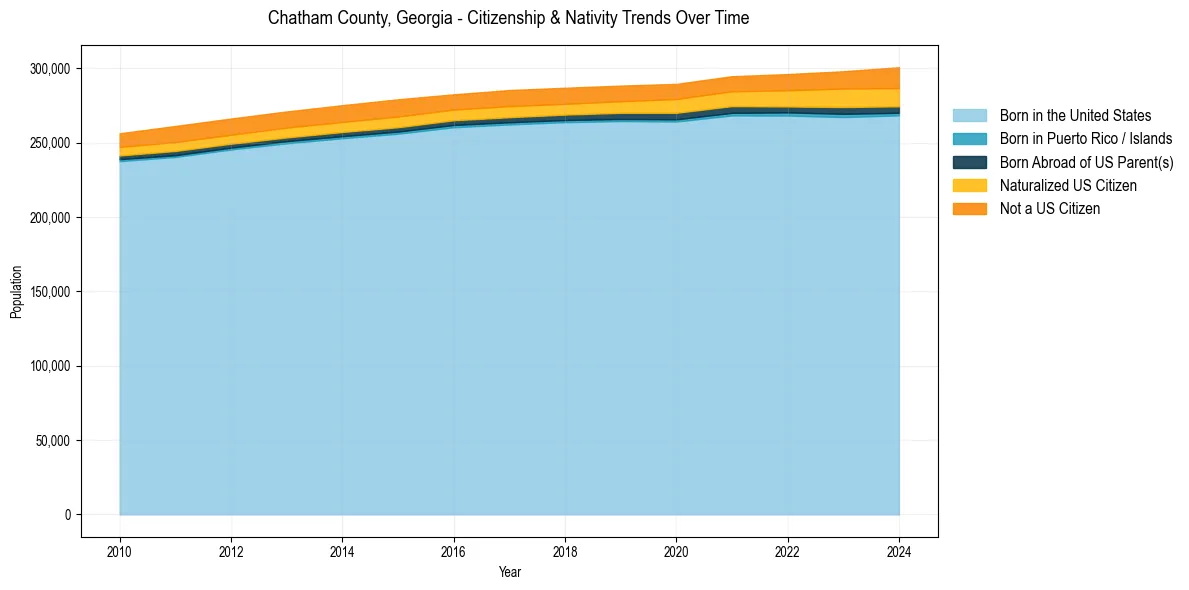
Chatham County, Georgia Population & Nativity History
| Year | Total Pop | Foreign Born | Native Born |
|---|---|---|---|
| 2024 | 300,879 | 8.7% | 91.3% |
| 2023 | 298,143 | 8.1% | 91.9% |
| 2022 | 296,266 | 7.4% | 92.6% |
| 2021 | 294,815 | 6.8% | 93.2% |
| 2020 | 289,649 | 6.7% | 93.3% |
| 2019 | 288,496 | 6.3% | 93.7% |
| 2018 | 287,049 | 6.3% | 93.7% |
| 2017 | 285,506 | 6.4% | 93.6% |
| 2016 | 282,613 | 6.2% | 93.8% |
| 2015 | 279,290 | 6.7% | 93.3% |
| 2014 | 275,303 | 6.6% | 93.4% |
| 2013 | 271,102 | 6.5% | 93.5% |
| 2012 | 266,344 | 6.4% | 93.6% |
| 2011 | 261,322 | 6.4% | 93.6% |
| 2010 | 256,428 | 5.8% | 94.2% |
Nativity & Citizenship FAQs for Chatham County, Georgia
Approximately 8.7% of residents in Chatham County, Georgia were born outside the United States.
The vast majority of residents, roughly 95.3%, are U.S. citizens (including both native-born and naturalized citizens).