Cherokee County, Georgia Nativity & Citizenship Status (2024)
Place of birth and citizenship status analysis for Cherokee County, Georgia
Cherokee County, Georgia Nativity & Citizenship Indicators (2024)
Native Born
89.7%
Foreign Born
10.3%
Naturalized
4.4%
US Citizens
94.1%
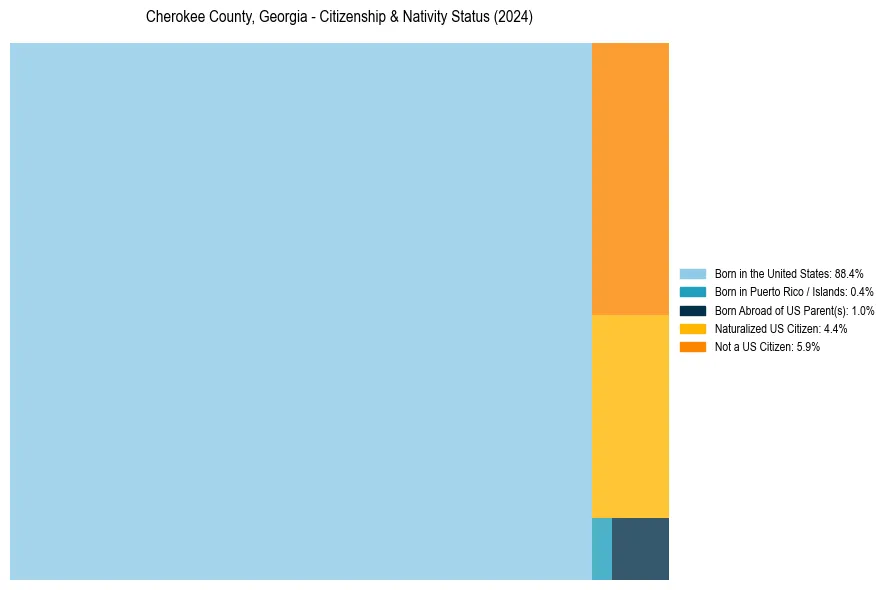
Cherokee County, Georgia Nativity & Citizenship Distribution
Cherokee County, Georgia Historical Nativity Trends (2010–2024)
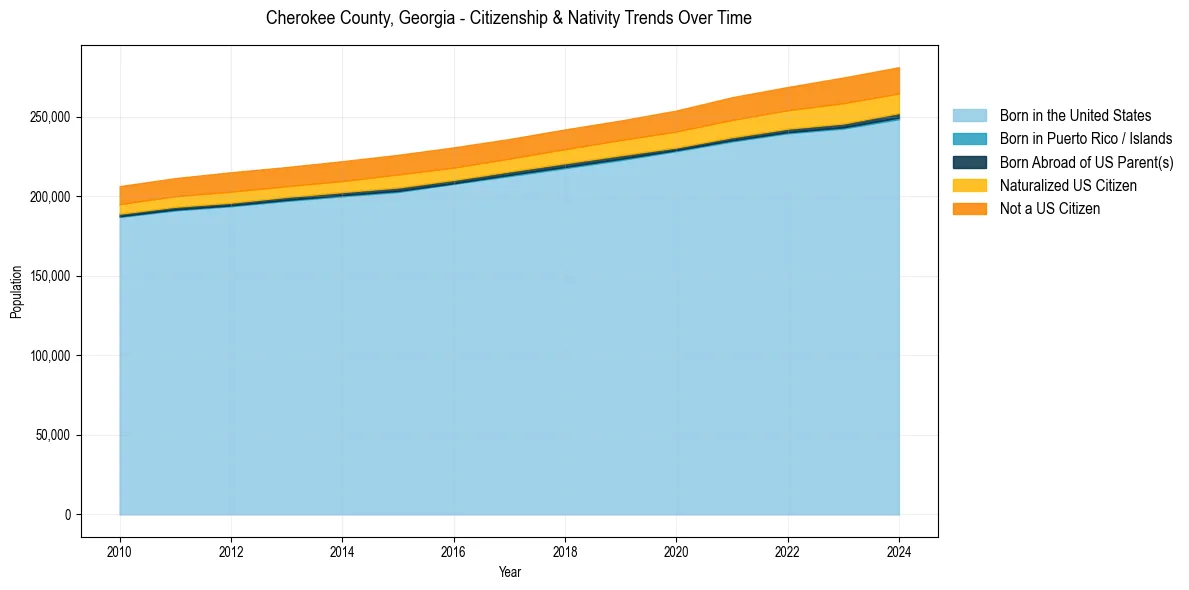
Cherokee County, Georgia Population & Nativity History
| Year | Total Pop | Foreign Born | Native Born |
|---|---|---|---|
| 2024 | 281,032 | 10.3% | 89.7% |
| 2023 | 274,539 | 10.5% | 89.5% |
| 2022 | 268,567 | 9.8% | 90.2% |
| 2021 | 262,155 | 9.6% | 90.4% |
| 2020 | 253,780 | 9.2% | 90.8% |
| 2019 | 247,515 | 8.8% | 91.2% |
| 2018 | 241,910 | 8.8% | 91.2% |
| 2017 | 235,896 | 8.6% | 91.4% |
| 2016 | 230,629 | 8.9% | 91.1% |
| 2015 | 225,944 | 9.1% | 90.9% |
| 2014 | 221,951 | 8.8% | 91.2% |
| 2013 | 218,277 | 8.6% | 91.4% |
| 2012 | 215,014 | 8.9% | 91.1% |
| 2011 | 211,316 | 8.5% | 91.5% |
| 2010 | 206,283 | 8.4% | 91.6% |
Nativity & Citizenship FAQs for Cherokee County, Georgia
Approximately 10.3% of residents in Cherokee County, Georgia were born outside the United States.
The vast majority of residents, roughly 94.1%, are U.S. citizens (including both native-born and naturalized citizens).