Clarke County, Georgia Nativity & Citizenship Status (2024)
Place of birth and citizenship status analysis for Clarke County, Georgia
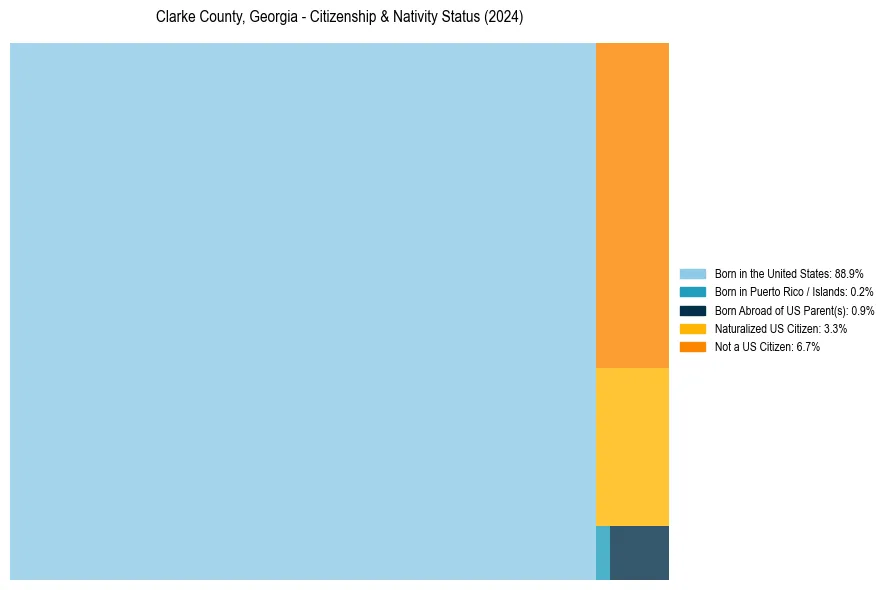
Clarke County, Georgia Nativity & Citizenship Indicators (2024)
Native Born
90.1%
Foreign Born
9.9%
Naturalized
3.3%
US Citizens
93.3%
Clarke County, Georgia Nativity & Citizenship Distribution
Clarke County, Georgia Historical Nativity Trends (2010–2024)
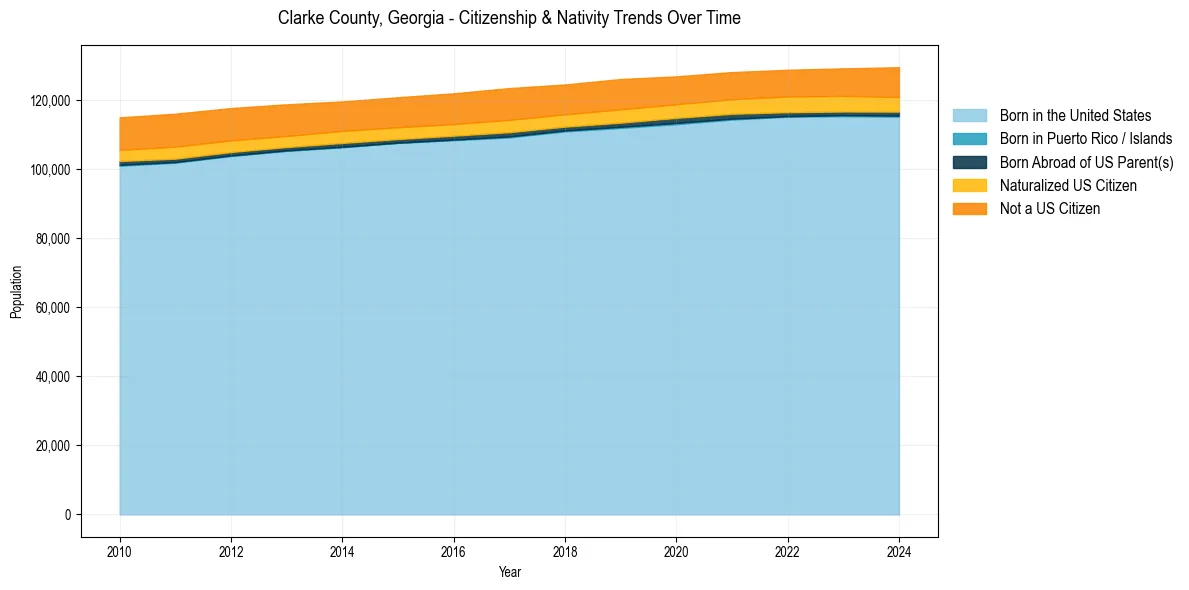
Clarke County, Georgia Population & Nativity History
| Year | Total Pop | Foreign Born | Native Born |
|---|---|---|---|
| 2024 | 129,609 | 9.9% | 90.1% |
| 2023 | 129,267 | 9.7% | 90.3% |
| 2022 | 128,864 | 9.5% | 90.5% |
| 2021 | 128,195 | 9.4% | 90.6% |
| 2020 | 126,952 | 9.5% | 90.5% |
| 2019 | 126,176 | 10.0% | 90.0% |
| 2018 | 124,602 | 9.8% | 90.2% |
| 2017 | 123,554 | 10.3% | 89.7% |
| 2016 | 122,037 | 10.1% | 89.9% |
| 2015 | 120,905 | 10.0% | 90.0% |
| 2014 | 119,681 | 10.1% | 89.9% |
| 2013 | 118,864 | 10.4% | 89.6% |
| 2012 | 117,762 | 10.8% | 89.2% |
| 2011 | 116,131 | 11.2% | 88.8% |
| 2010 | 115,070 | 11.0% | 89.0% |
Nativity & Citizenship FAQs for Clarke County, Georgia
Approximately 9.9% of residents in Clarke County, Georgia were born outside the United States.
The vast majority of residents, roughly 93.3%, are U.S. citizens (including both native-born and naturalized citizens).