Cobb County, Georgia Nativity & Citizenship Status (2024)
Place of birth and citizenship status analysis for Cobb County, Georgia
Cobb County, Georgia Nativity & Citizenship Indicators (2024)
Native Born
83.5%
Foreign Born
16.5%
Naturalized
8.0%
US Citizens
91.4%
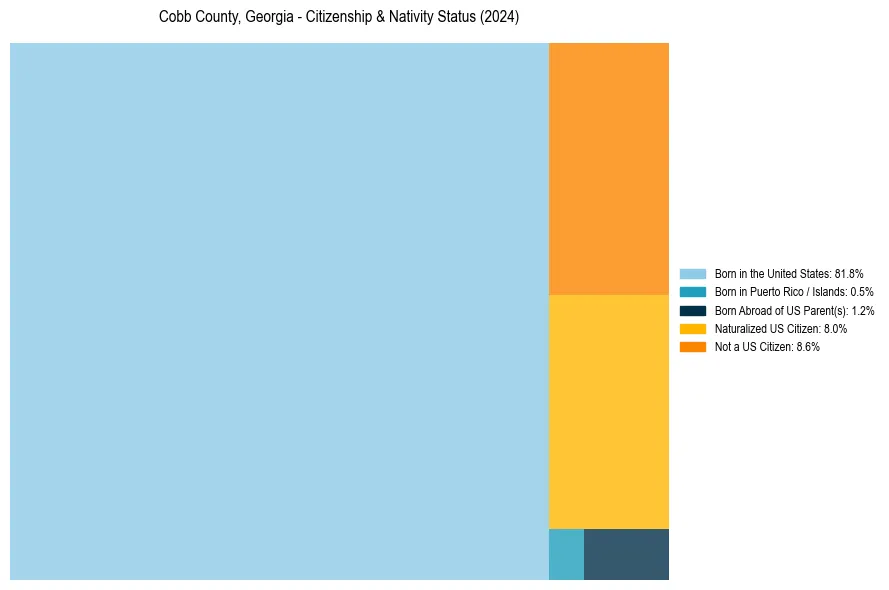
Cobb County, Georgia Nativity & Citizenship Distribution
Cobb County, Georgia Historical Nativity Trends (2010–2024)
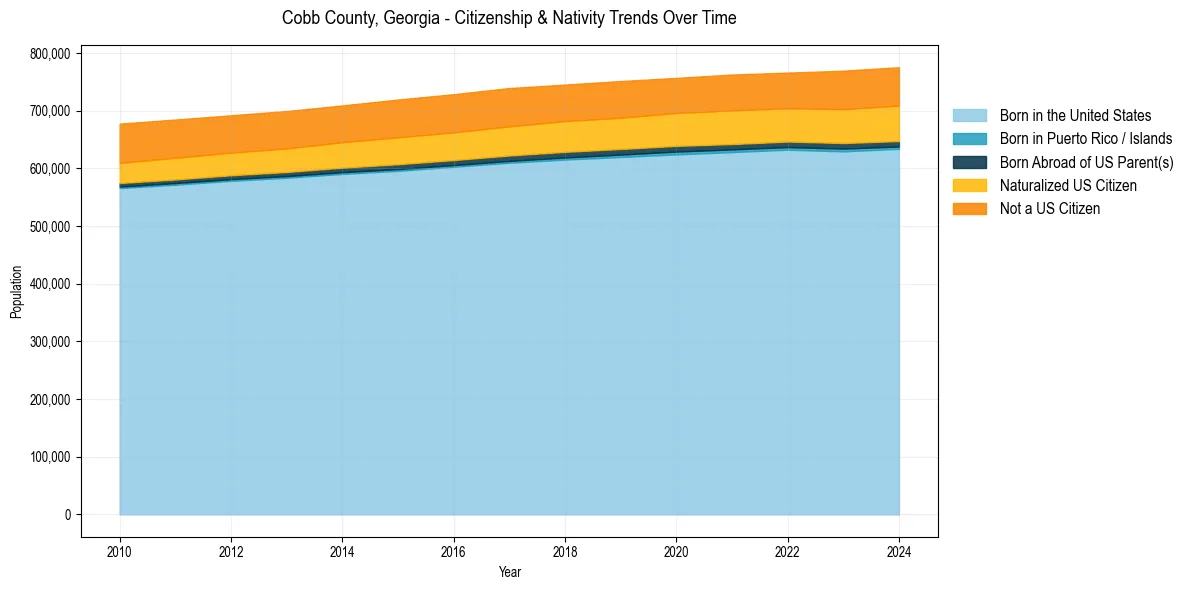
Cobb County, Georgia Population & Nativity History
| Year | Total Pop | Foreign Born | Native Born |
|---|---|---|---|
| 2024 | 775,208 | 16.5% | 83.5% |
| 2023 | 769,152 | 16.3% | 83.7% |
| 2022 | 765,813 | 15.6% | 84.4% |
| 2021 | 762,500 | 15.8% | 84.2% |
| 2020 | 756,653 | 15.6% | 84.4% |
| 2019 | 751,218 | 15.7% | 84.3% |
| 2018 | 745,057 | 15.7% | 84.3% |
| 2017 | 739,072 | 15.8% | 84.2% |
| 2016 | 728,388 | 15.7% | 84.3% |
| 2015 | 719,133 | 15.6% | 84.4% |
| 2014 | 708,920 | 15.2% | 84.8% |
| 2013 | 699,235 | 15.1% | 84.9% |
| 2012 | 691,820 | 15.0% | 85.0% |
| 2011 | 684,468 | 15.2% | 84.8% |
| 2010 | 677,402 | 15.2% | 84.8% |
Nativity & Citizenship FAQs for Cobb County, Georgia
Approximately 16.5% of residents in Cobb County, Georgia were born outside the United States.
The vast majority of residents, roughly 91.4%, are U.S. citizens (including both native-born and naturalized citizens).