Columbia County, Georgia Nativity & Citizenship Status (2024)
Place of birth and citizenship status analysis for Columbia County, Georgia
Columbia County, Georgia Nativity & Citizenship Indicators (2024)
Native Born
92.7%
Foreign Born
7.3%
Naturalized
4.4%
US Citizens
97.0%
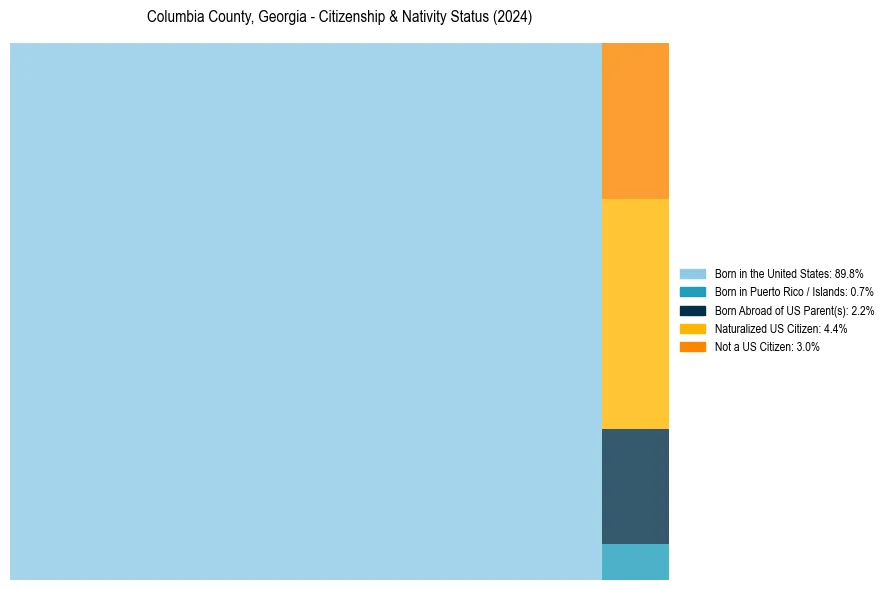
Columbia County, Georgia Nativity & Citizenship Distribution
Columbia County, Georgia Historical Nativity Trends (2010–2024)
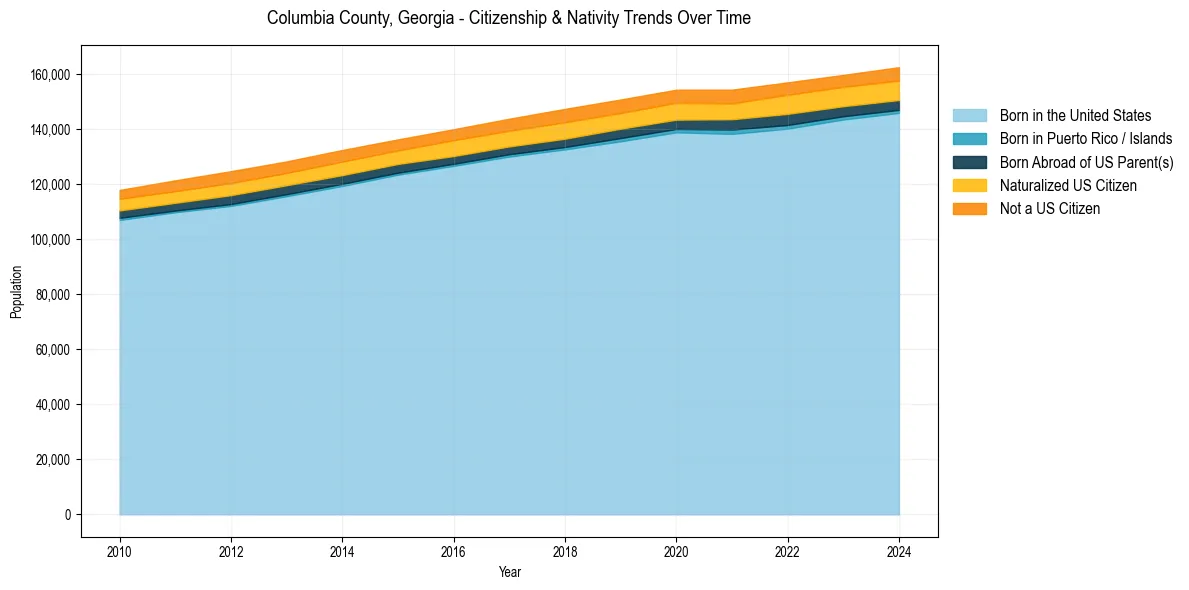
Columbia County, Georgia Population & Nativity History
| Year | Total Pop | Foreign Born | Native Born |
|---|---|---|---|
| 2024 | 162,434 | 7.3% | 92.7% |
| 2023 | 159,638 | 7.1% | 92.9% |
| 2022 | 156,921 | 7.3% | 92.7% |
| 2021 | 154,274 | 7.0% | 93.0% |
| 2020 | 154,257 | 7.1% | 92.9% |
| 2019 | 150,705 | 7.1% | 92.9% |
| 2018 | 147,295 | 7.4% | 92.6% |
| 2017 | 143,723 | 7.0% | 93.0% |
| 2016 | 139,904 | 7.0% | 93.0% |
| 2015 | 136,204 | 6.5% | 93.5% |
| 2014 | 132,362 | 6.9% | 93.1% |
| 2013 | 128,213 | 6.8% | 93.2% |
| 2012 | 124,665 | 7.0% | 93.0% |
| 2011 | 121,335 | 6.7% | 93.3% |
| 2010 | 117,858 | 6.3% | 93.7% |
Nativity & Citizenship FAQs for Columbia County, Georgia
Approximately 7.3% of residents in Columbia County, Georgia were born outside the United States.
The vast majority of residents, roughly 97.0%, are U.S. citizens (including both native-born and naturalized citizens).