Dawson County, Georgia Nativity & Citizenship Status (2024)
Place of birth and citizenship status analysis for Dawson County, Georgia
Dawson County, Georgia Nativity & Citizenship Indicators (2024)
Native Born
94.8%
Foreign Born
5.2%
Naturalized
2.4%
US Citizens
97.2%
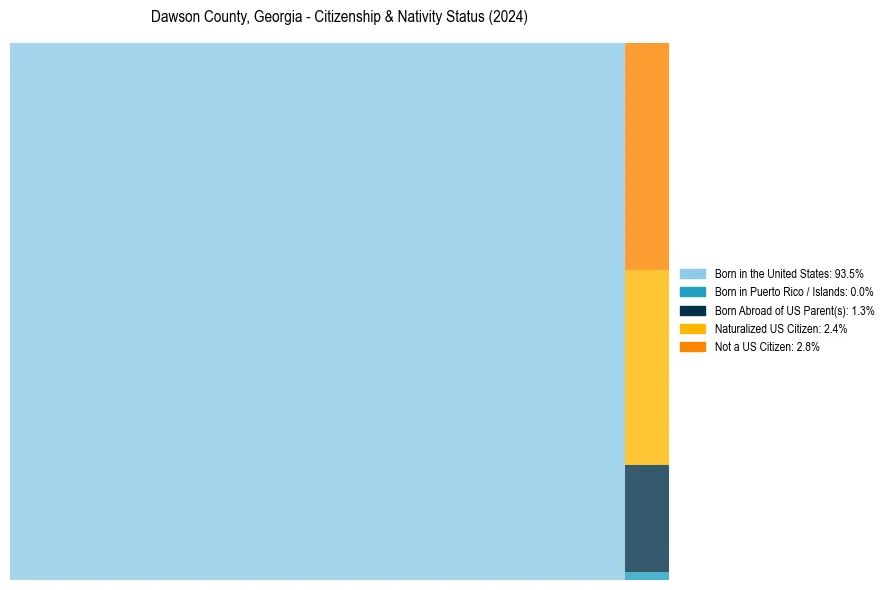
Dawson County, Georgia Nativity & Citizenship Distribution
Dawson County, Georgia Historical Nativity Trends (2010–2024)
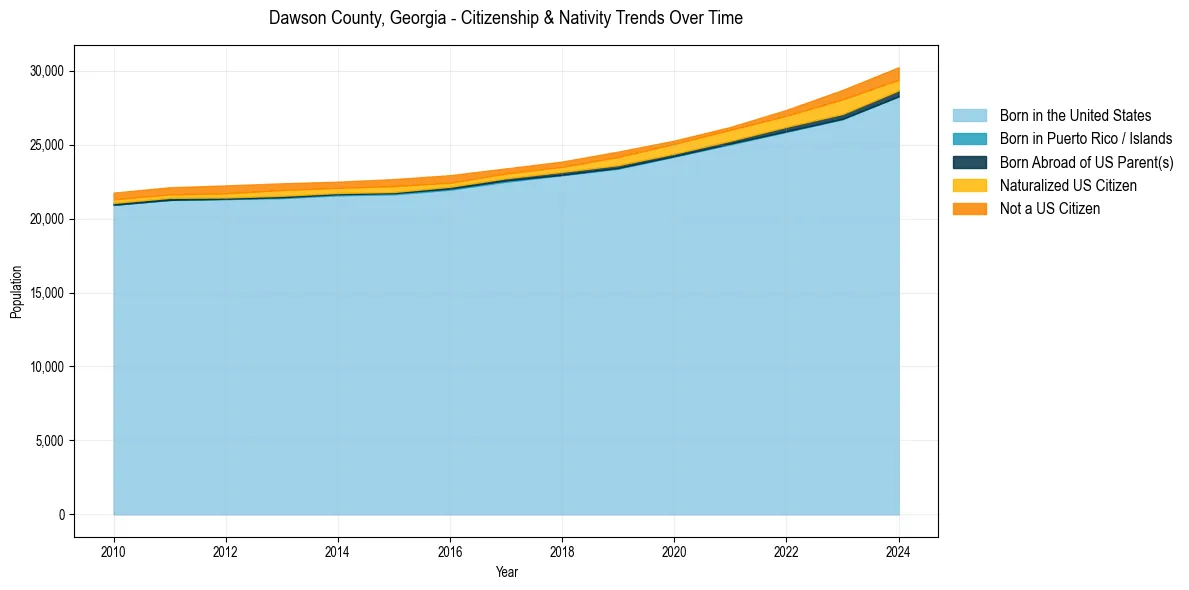
Dawson County, Georgia Population & Nativity History
| Year | Total Pop | Foreign Born | Native Born |
|---|---|---|---|
| 2024 | 30,242 | 5.2% | 94.8% |
| 2023 | 28,704 | 5.7% | 94.3% |
| 2022 | 27,355 | 4.2% | 95.8% |
| 2021 | 26,202 | 3.6% | 96.4% |
| 2020 | 25,277 | 3.5% | 96.5% |
| 2019 | 24,536 | 3.7% | 96.3% |
| 2018 | 23,861 | 2.9% | 97.1% |
| 2017 | 23,397 | 2.9% | 97.1% |
| 2016 | 22,939 | 3.4% | 96.6% |
| 2015 | 22,673 | 3.9% | 96.1% |
| 2014 | 22,500 | 3.4% | 96.6% |
| 2013 | 22,387 | 3.8% | 96.2% |
| 2012 | 22,246 | 3.7% | 96.3% |
| 2011 | 22,121 | 3.2% | 96.8% |
| 2010 | 21,758 | 3.2% | 96.8% |
Nativity & Citizenship FAQs for Dawson County, Georgia
Approximately 5.2% of residents in Dawson County, Georgia were born outside the United States.
The vast majority of residents, roughly 97.2%, are U.S. citizens (including both native-born and naturalized citizens).