Fulton County, Georgia Nativity & Citizenship Status (2024)
Place of birth and citizenship status analysis for Fulton County, Georgia
Fulton County, Georgia Nativity & Citizenship Indicators (2024)
Native Born
85.9%
Foreign Born
14.1%
Naturalized
7.2%
US Citizens
93.1%
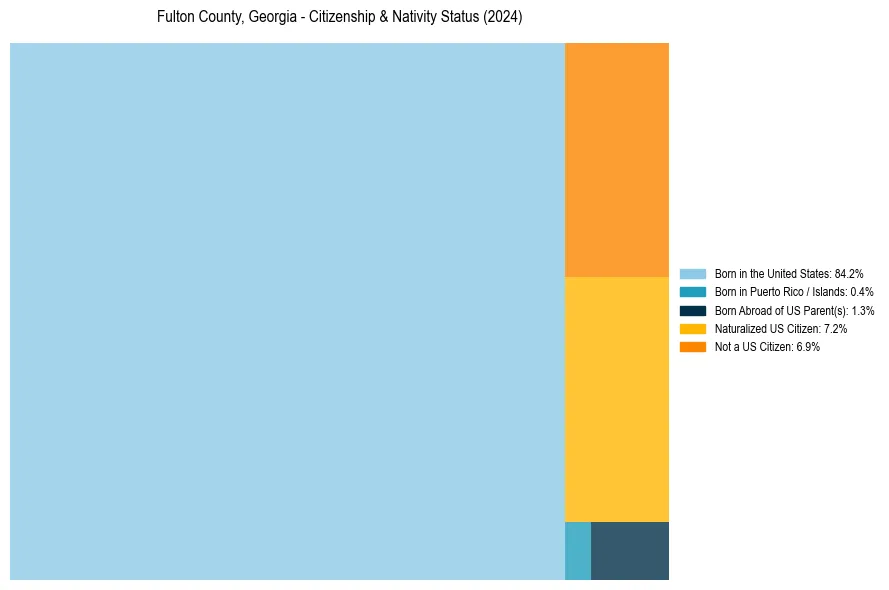
Fulton County, Georgia Nativity & Citizenship Distribution
Fulton County, Georgia Historical Nativity Trends (2010–2024)
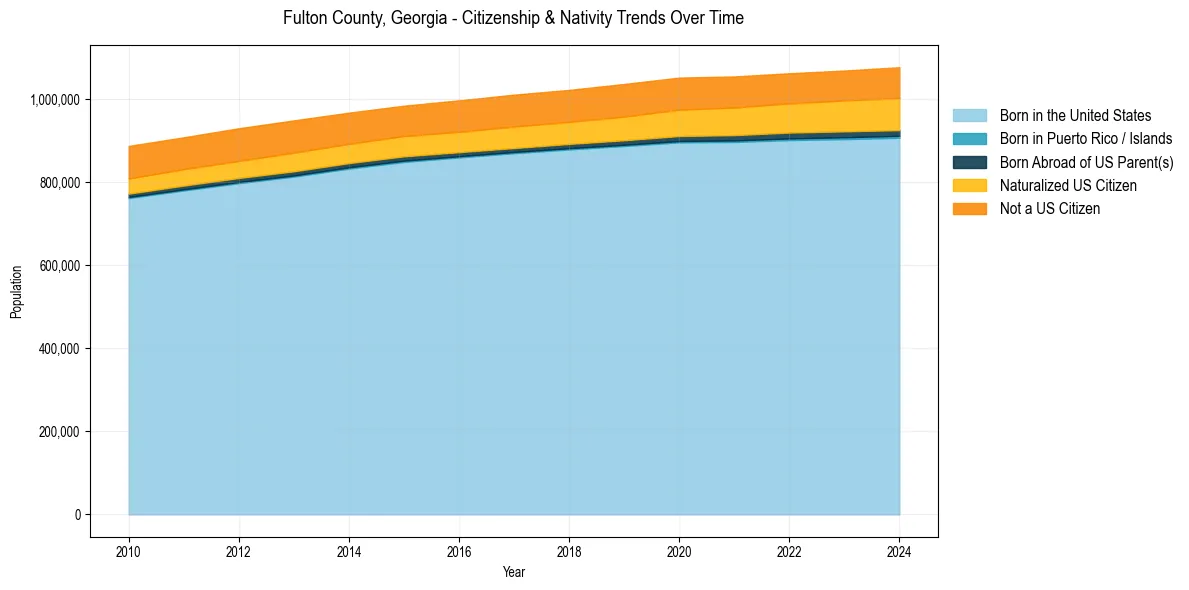
Fulton County, Georgia Population & Nativity History
| Year | Total Pop | Foreign Born | Native Born |
|---|---|---|---|
| 2024 | 1,076,561 | 14.1% | 85.9% |
| 2023 | 1,068,507 | 13.7% | 86.3% |
| 2022 | 1,061,944 | 13.4% | 86.6% |
| 2021 | 1,054,286 | 13.4% | 86.6% |
| 2020 | 1,051,550 | 13.4% | 86.6% |
| 2019 | 1,036,200 | 13.1% | 86.9% |
| 2018 | 1,021,902 | 12.7% | 87.3% |
| 2017 | 1,010,420 | 12.7% | 87.3% |
| 2016 | 996,757 | 12.5% | 87.5% |
| 2015 | 983,903 | 12.4% | 87.6% |
| 2014 | 967,100 | 12.6% | 87.4% |
| 2013 | 948,554 | 12.9% | 87.1% |
| 2012 | 929,535 | 12.9% | 87.1% |
| 2011 | 907,811 | 12.8% | 87.2% |
| 2010 | 886,982 | 13.0% | 87.0% |
Nativity & Citizenship FAQs for Fulton County, Georgia
Approximately 14.1% of residents in Fulton County, Georgia were born outside the United States.
The vast majority of residents, roughly 93.1%, are U.S. citizens (including both native-born and naturalized citizens).