Fulton County, Georgia Race & Ethnicity Demographics (2024)
Racial distribution and diversity statistics for Fulton County, Georgia
Fulton County, Georgia Diversity Indicators (2024)
Total Population
1,076,561
Diversity Score
67.2
Diversity Tier
High
Largest Group
Black / African American
42.1%%
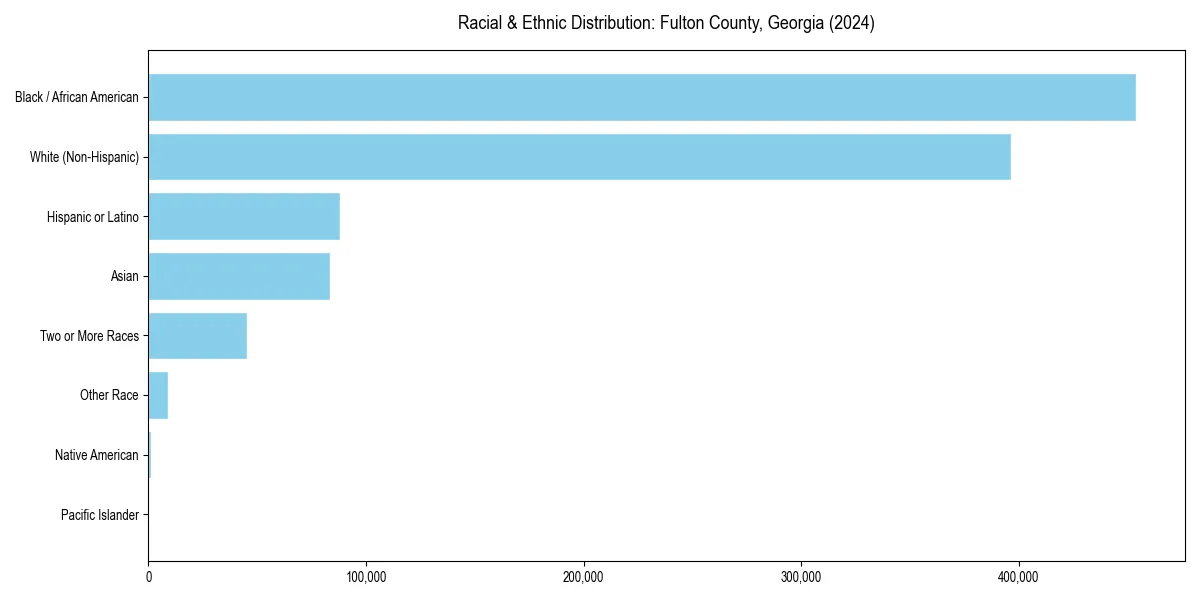
Fulton County, Georgia Racial & Ethnic Breakdown
Fulton County, Georgia Historical Diversity Trend (2010–2024)
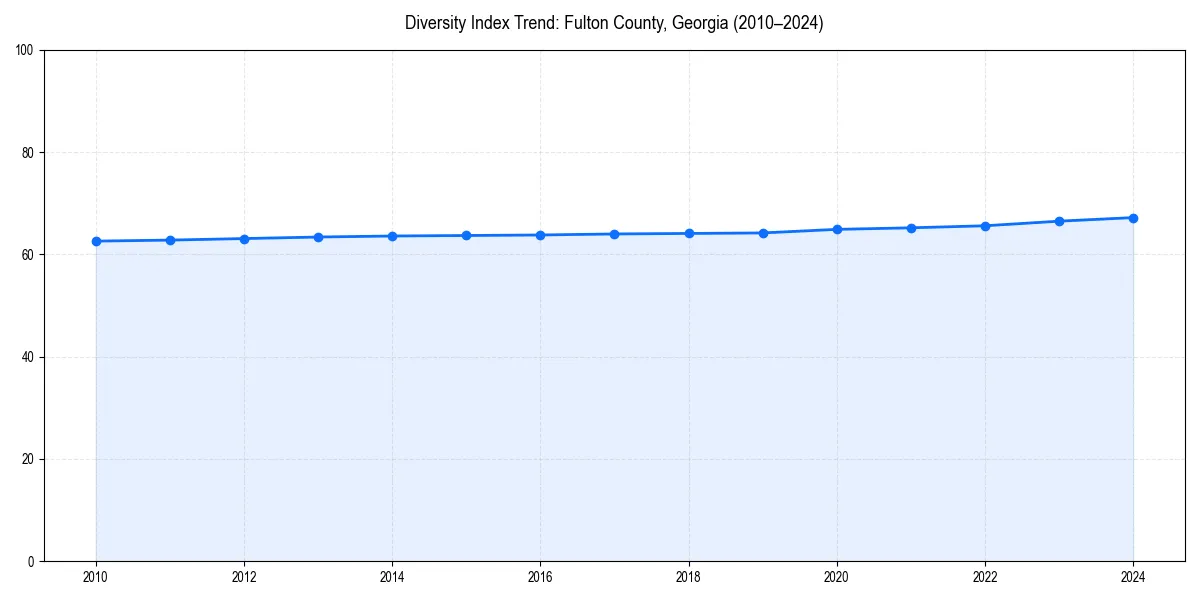
Since 2010, the diversity index of Fulton County, Georgia has increased slightly.
Fulton County, Georgia Population by Race & Ethnicity
| Race / Ethnicity | Population | Percentage |
|---|---|---|
| Black / African American | 453,703 | 42.1% |
| White (Non-Hispanic) | 396,329 | 36.8% |
| Hispanic or Latino | 87,967 | 8.2% |
| Asian | 83,505 | 7.8% |
| Two or More Races | 45,078 | 4.2% |
| Other Race | 8,850 | 0.8% |
| Native American | 964 | 0.1% |
| Pacific Islander | 165 | 0.0% |
Diversity & Demographics FAQs for Fulton County, Georgia
The largest racial or ethnic group in Fulton County, Georgia is Black / African American, which makes up 42.1% of the total population.
Since 2010, the diversity index for Fulton County, Georgia has increased slightly. The area currently has a diversity score of 67.2/100, which is considered a High level of diversity.