Gwinnett County, Georgia Nativity & Citizenship Status (2024)
Place of birth and citizenship status analysis for Gwinnett County, Georgia
Gwinnett County, Georgia Nativity & Citizenship Indicators (2024)
Native Born
71.6%
Foreign Born
28.4%
Naturalized
14.0%
US Citizens
85.6%
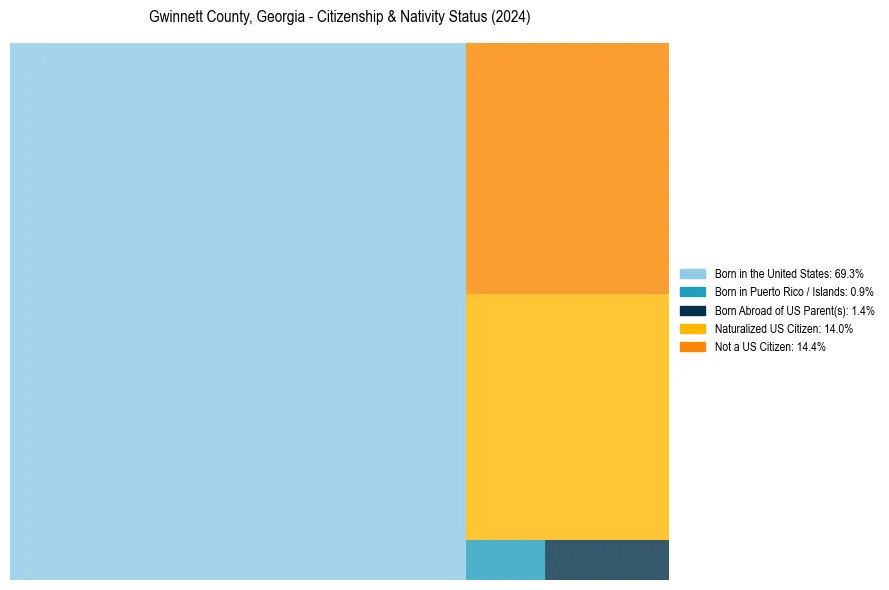
Gwinnett County, Georgia Nativity & Citizenship Distribution
Gwinnett County, Georgia Historical Nativity Trends (2010–2024)
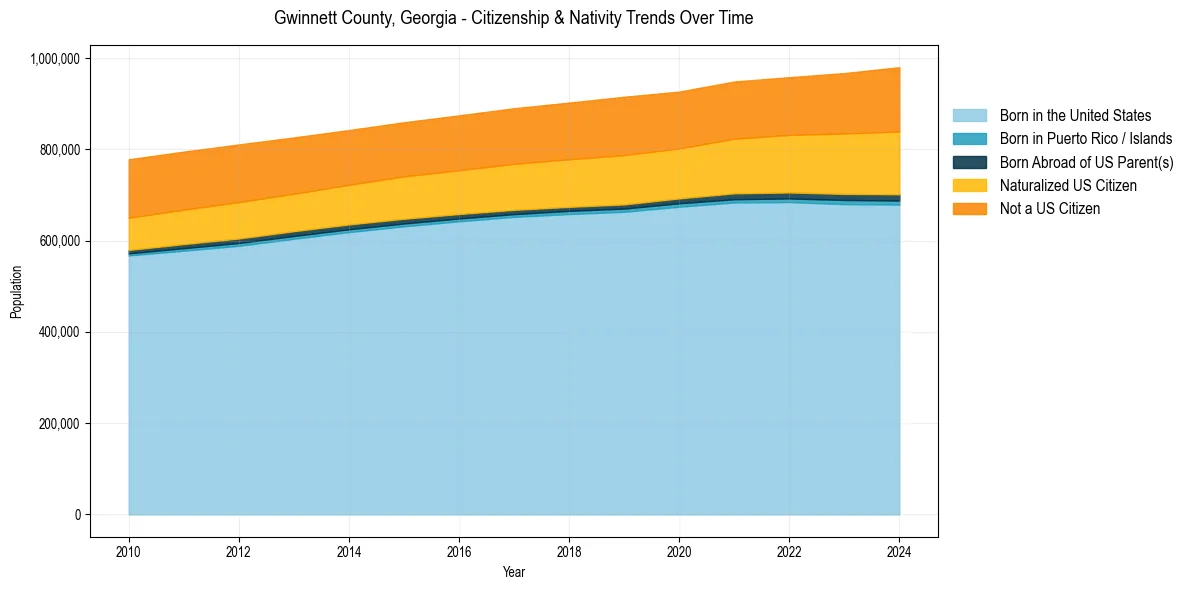
Gwinnett County, Georgia Population & Nativity History
| Year | Total Pop | Foreign Born | Native Born |
|---|---|---|---|
| 2024 | 979,864 | 28.4% | 71.6% |
| 2023 | 966,972 | 27.4% | 72.6% |
| 2022 | 957,977 | 26.4% | 73.6% |
| 2021 | 948,505 | 25.8% | 74.2% |
| 2020 | 926,414 | 25.3% | 74.7% |
| 2019 | 915,046 | 25.8% | 74.2% |
| 2018 | 902,298 | 25.3% | 74.7% |
| 2017 | 889,954 | 25.0% | 75.0% |
| 2016 | 874,242 | 24.7% | 75.3% |
| 2015 | 859,234 | 24.6% | 75.4% |
| 2014 | 842,091 | 24.6% | 75.4% |
| 2013 | 825,911 | 24.9% | 75.1% |
| 2012 | 810,624 | 25.4% | 74.6% |
| 2011 | 794,872 | 25.5% | 74.5% |
| 2010 | 778,022 | 25.5% | 74.5% |
Nativity & Citizenship FAQs for Gwinnett County, Georgia
Approximately 28.4% of residents in Gwinnett County, Georgia were born outside the United States.
The vast majority of residents, roughly 85.6%, are U.S. citizens (including both native-born and naturalized citizens).