Georgia Nativity & Citizenship Status (2024)
Place of birth and citizenship status analysis for Georgia
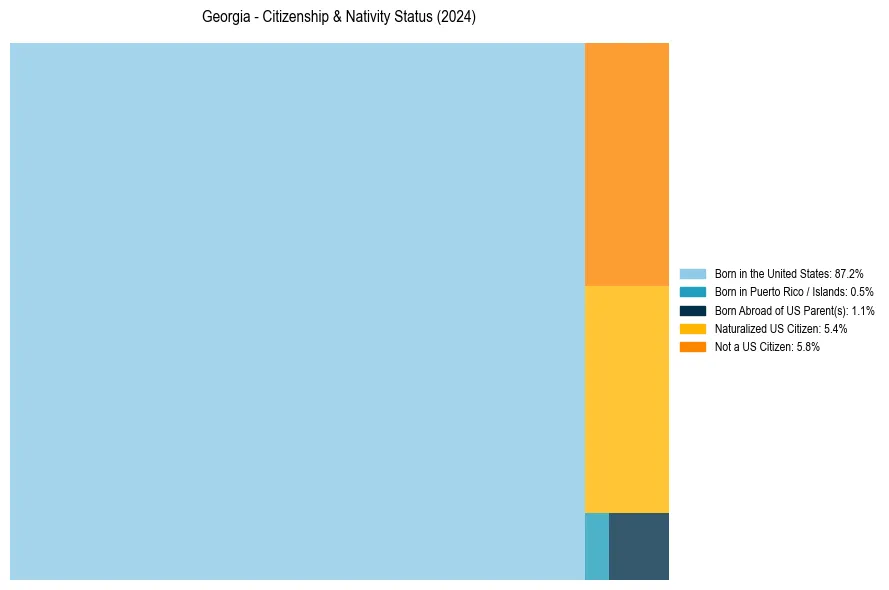
Georgia Nativity & Citizenship Indicators (2024)
Native Born
88.8%
Foreign Born
11.2%
Naturalized
5.4%
US Citizens
94.2%
Georgia Nativity & Citizenship Distribution
Georgia Historical Nativity Trends (2010–2024)
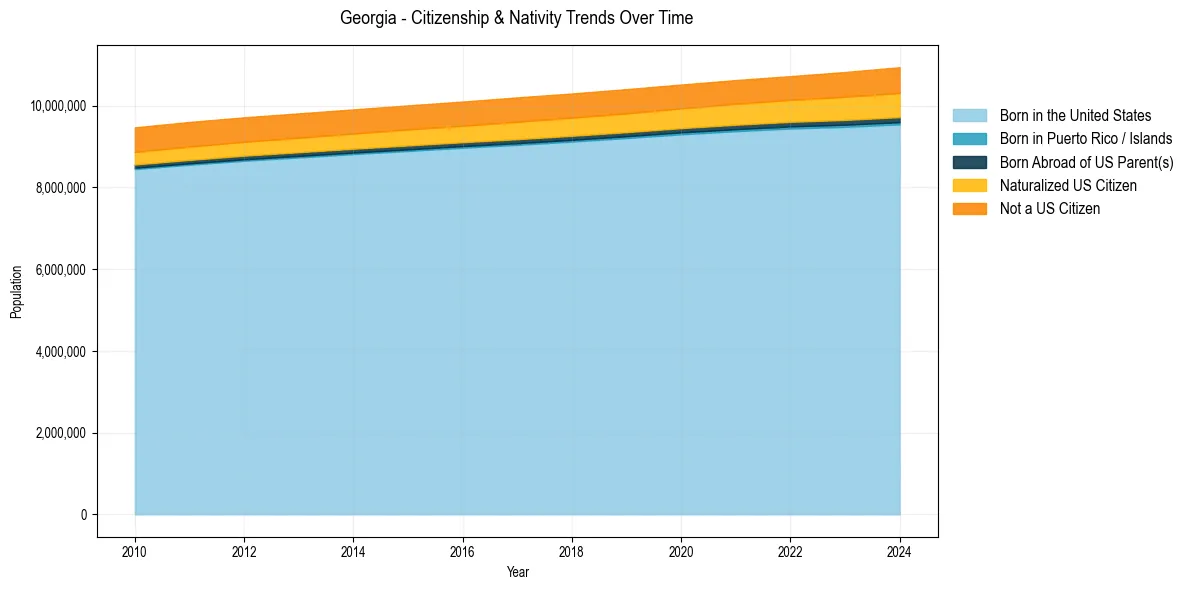
Georgia Population & Nativity History
| Year | Total Pop | Foreign Born | Native Born |
|---|---|---|---|
| 2024 | 10,940,407 | 11.2% | 88.8% |
| 2023 | 10,822,590 | 10.8% | 89.2% |
| 2022 | 10,722,325 | 10.4% | 89.6% |
| 2021 | 10,625,615 | 10.3% | 89.7% |
| 2020 | 10,516,579 | 10.2% | 89.8% |
| 2019 | 10,403,847 | 10.1% | 89.9% |
| 2018 | 10,297,484 | 10.1% | 89.9% |
| 2017 | 10,201,635 | 10.0% | 90.0% |
| 2016 | 10,099,320 | 9.8% | 90.2% |
| 2015 | 10,006,693 | 9.8% | 90.2% |
| 2014 | 9,907,756 | 9.7% | 90.3% |
| 2013 | 9,810,417 | 9.7% | 90.3% |
| 2012 | 9,714,569 | 9.7% | 90.3% |
| 2011 | 9,600,612 | 9.7% | 90.3% |
| 2010 | 9,468,815 | 9.6% | 90.4% |
Nativity & Citizenship FAQs for Georgia
Approximately 11.2% of residents in Georgia were born outside the United States.
The vast majority of residents, roughly 94.2%, are U.S. citizens (including both native-born and naturalized citizens).