Oconee County, Georgia Health Insurance Coverage (2024)
Detailed analysis of uninsured rates and coverage trends for Oconee County, Georgia
Universe
43,365
Total Uninsured
2,966
Uninsured Rate
6.8%
Coverage by Age and Gender
Distribution of insured vs. uninsured residents in Oconee County, Georgia
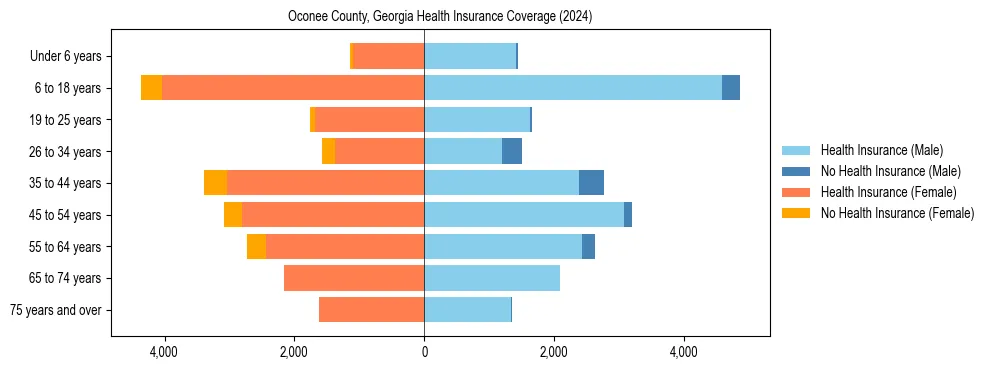
Uninsured Rates by Demographic Group
Under 18 Years
Male Uninsured4.6%
Female Uninsured6.9%
18 to 34 Years
Male Uninsured10.8%
Female Uninsured8.5%
35 to 64 Years
Male Uninsured8.3%
Female Uninsured10.0%
65 Years & Over
Male Uninsured0.6%
Female Uninsured0.2%
Uninsured Rate Trends
Historical coverage data from 2012 to 2024
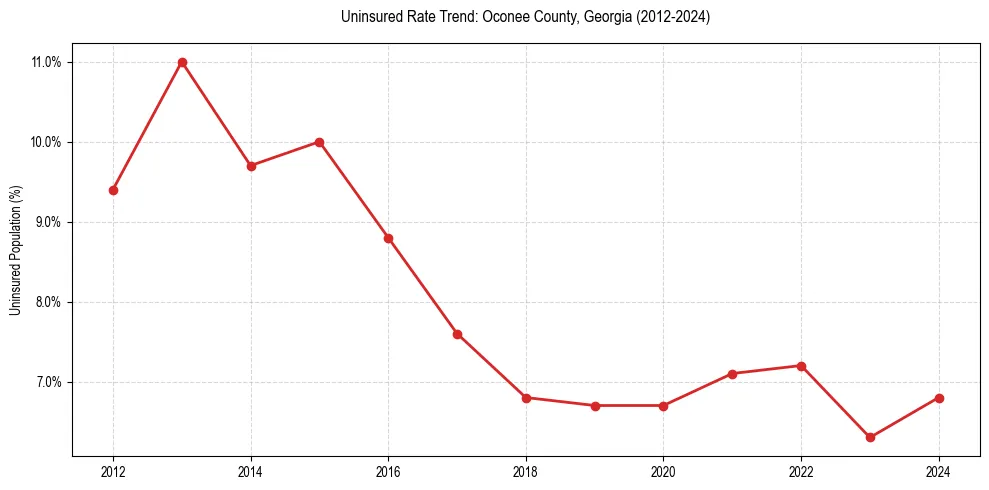
| Year | Total Uninsured | Uninsured Rate |
|---|---|---|
| 2024 | 2,966 | 6.8% |
| 2023 | 2,668 | 6.3% |
| 2022 | 3,015 | 7.2% |
| 2021 | 2,894 | 7.1% |
| 2020 | 2,612 | 6.7% |
| 2019 | 2,529 | 6.7% |
| 2018 | 2,492 | 6.8% |
| 2017 | 2,729 | 7.6% |
| 2016 | 3,058 | 8.8% |
| 2015 | 3,417 | 10.0% |
| 2014 | 3,255 | 9.7% |
| 2013 | 3,637 | 11.0% |
| 2012 | 3,076 | 9.4% |
Frequently Asked Questions
Approximately 6.8% of the population in Oconee County, Georgia does not have health insurance coverage.
In Oconee County, Georgia, young adult males (18-34) face the highest barrier to coverage, with an uninsured rate of 10.8%. This is notably higher than the overall local average of 6.8%.