Paulding County, Georgia Nativity & Citizenship Status (2024)
Place of birth and citizenship status analysis for Paulding County, Georgia
Paulding County, Georgia Nativity & Citizenship Indicators (2024)
Native Born
92.1%
Foreign Born
7.9%
Naturalized
4.3%
US Citizens
96.4%
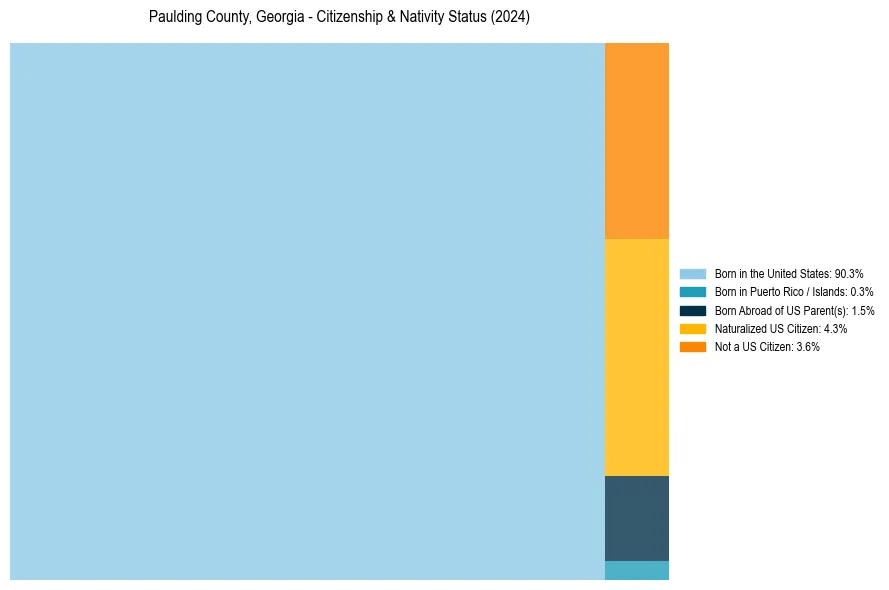
Paulding County, Georgia Nativity & Citizenship Distribution
Paulding County, Georgia Historical Nativity Trends (2010–2024)
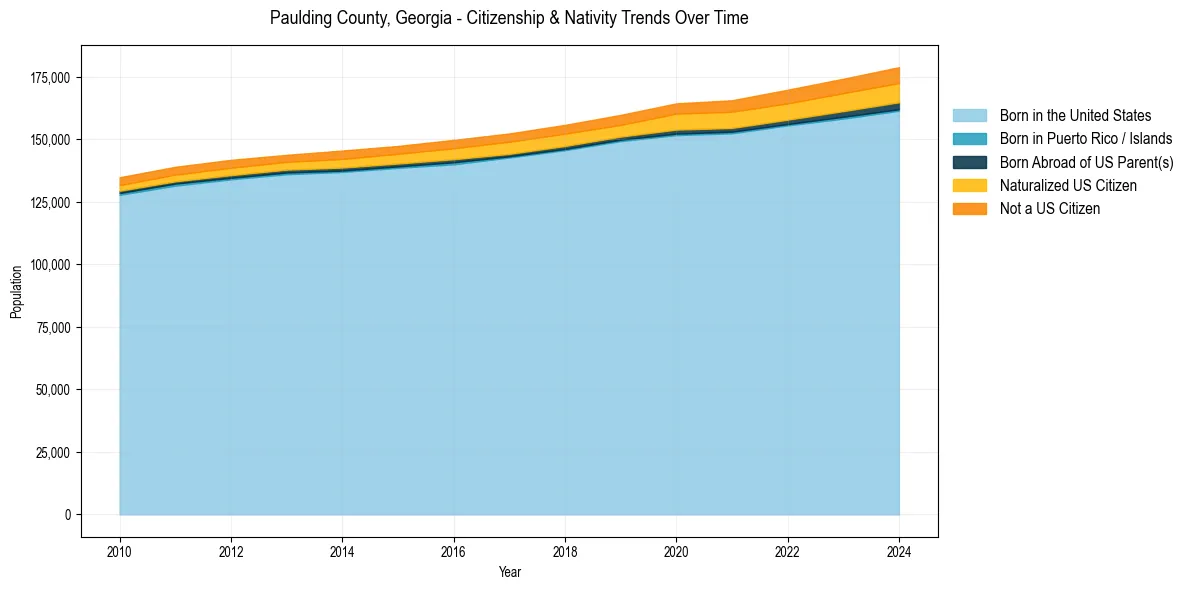
Paulding County, Georgia Population & Nativity History
| Year | Total Pop | Foreign Born | Native Born |
|---|---|---|---|
| 2024 | 178,909 | 7.9% | 92.1% |
| 2023 | 174,292 | 7.4% | 92.6% |
| 2022 | 169,898 | 7.1% | 92.9% |
| 2021 | 165,688 | 6.7% | 93.3% |
| 2020 | 164,440 | 6.4% | 93.6% |
| 2019 | 159,825 | 5.4% | 94.6% |
| 2018 | 155,840 | 5.4% | 94.6% |
| 2017 | 152,399 | 5.4% | 94.6% |
| 2016 | 149,830 | 5.2% | 94.8% |
| 2015 | 147,400 | 4.8% | 95.2% |
| 2014 | 145,565 | 4.7% | 95.3% |
| 2013 | 143,845 | 4.1% | 95.9% |
| 2012 | 141,846 | 4.3% | 95.7% |
| 2011 | 139,067 | 4.2% | 95.8% |
| 2010 | 134,875 | 4.0% | 96.0% |
Nativity & Citizenship FAQs for Paulding County, Georgia
Approximately 7.9% of residents in Paulding County, Georgia were born outside the United States.
The vast majority of residents, roughly 96.4%, are U.S. citizens (including both native-born and naturalized citizens).