Richmond County, Georgia Nativity & Citizenship Status (2024)
Place of birth and citizenship status analysis for Richmond County, Georgia
Richmond County, Georgia Nativity & Citizenship Indicators (2024)
Native Born
96.2%
Foreign Born
3.8%
Naturalized
2.0%
US Citizens
98.2%
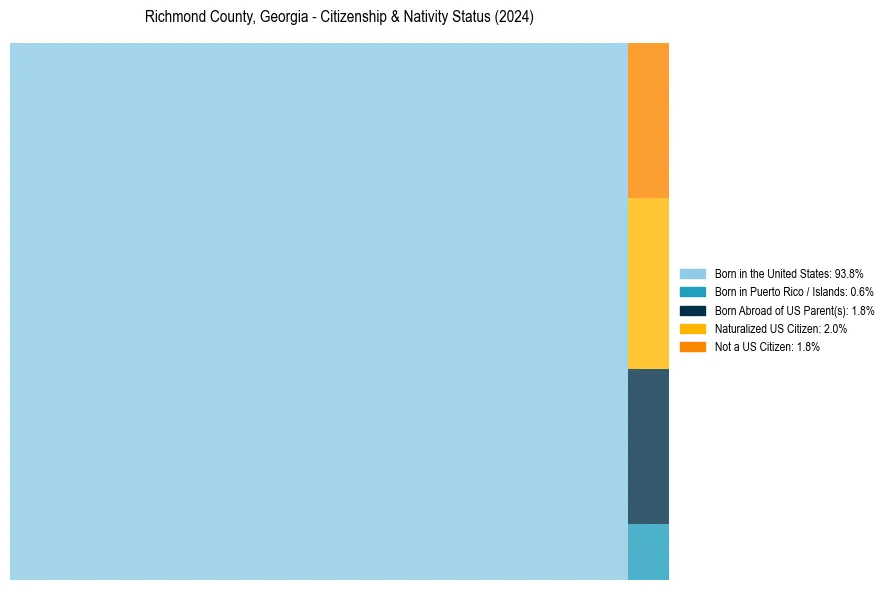
Richmond County, Georgia Nativity & Citizenship Distribution
Richmond County, Georgia Historical Nativity Trends (2010–2024)
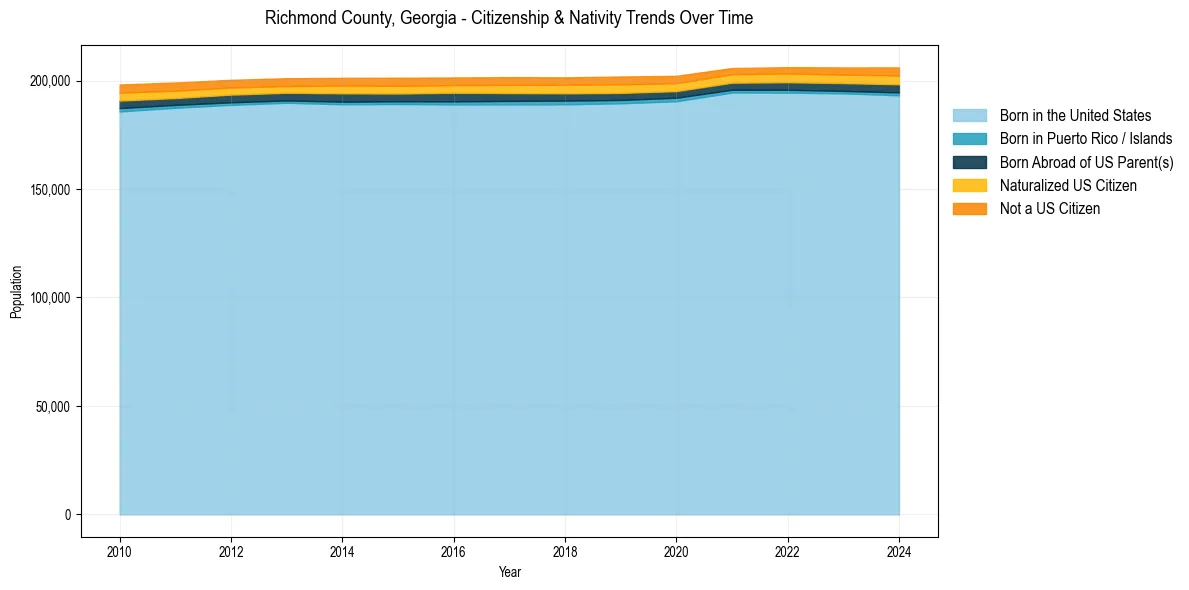
Richmond County, Georgia Population & Nativity History
| Year | Total Pop | Foreign Born | Native Born |
|---|---|---|---|
| 2024 | 206,069 | 3.8% | 96.2% |
| 2023 | 206,040 | 3.5% | 96.5% |
| 2022 | 206,153 | 3.4% | 96.6% |
| 2021 | 205,772 | 3.3% | 96.7% |
| 2020 | 202,178 | 3.5% | 96.5% |
| 2019 | 201,852 | 3.7% | 96.3% |
| 2018 | 201,463 | 3.7% | 96.3% |
| 2017 | 201,568 | 3.6% | 96.4% |
| 2016 | 201,418 | 3.5% | 96.5% |
| 2015 | 201,291 | 3.6% | 96.4% |
| 2014 | 201,244 | 3.6% | 96.4% |
| 2013 | 201,081 | 3.3% | 96.7% |
| 2012 | 200,337 | 3.4% | 96.6% |
| 2011 | 199,100 | 3.6% | 96.4% |
| 2010 | 198,170 | 3.7% | 96.3% |
Nativity & Citizenship FAQs for Richmond County, Georgia
Approximately 3.8% of residents in Richmond County, Georgia were born outside the United States.
The vast majority of residents, roughly 98.2%, are U.S. citizens (including both native-born and naturalized citizens).