Spalding County, Georgia Nativity & Citizenship Status (2024)
Place of birth and citizenship status analysis for Spalding County, Georgia
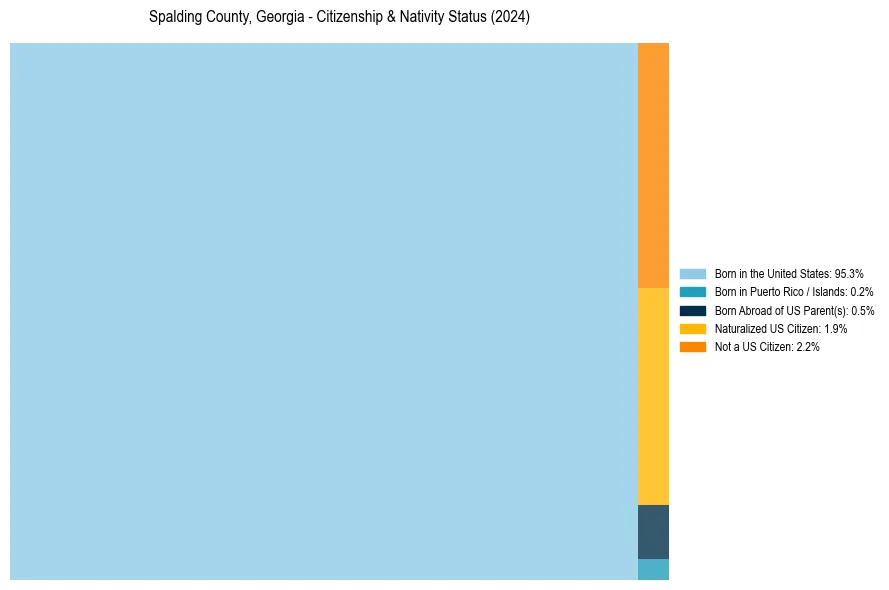
Spalding County, Georgia Nativity & Citizenship Indicators (2024)
Native Born
95.9%
Foreign Born
4.1%
Naturalized
1.9%
US Citizens
97.8%
Spalding County, Georgia Nativity & Citizenship Distribution
Spalding County, Georgia Historical Nativity Trends (2010–2024)
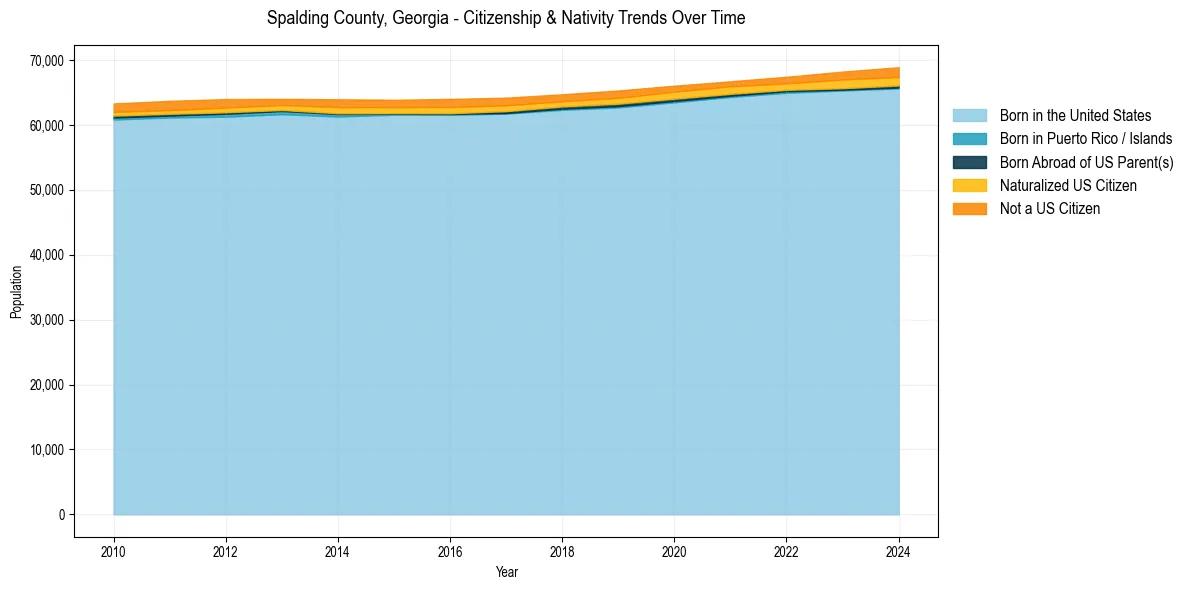
Spalding County, Georgia Population & Nativity History
| Year | Total Pop | Foreign Born | Native Born |
|---|---|---|---|
| 2024 | 68,892 | 4.1% | 95.9% |
| 2023 | 68,215 | 3.7% | 96.3% |
| 2022 | 67,415 | 3.0% | 97.0% |
| 2021 | 66,722 | 2.9% | 97.1% |
| 2020 | 66,043 | 3.0% | 97.0% |
| 2019 | 65,306 | 3.1% | 96.9% |
| 2018 | 64,719 | 2.9% | 97.1% |
| 2017 | 64,192 | 3.2% | 96.8% |
| 2016 | 64,006 | 3.4% | 96.6% |
| 2015 | 63,873 | 3.2% | 96.8% |
| 2014 | 63,946 | 3.4% | 96.6% |
| 2013 | 64,011 | 2.7% | 97.3% |
| 2012 | 63,979 | 3.2% | 96.8% |
| 2011 | 63,713 | 3.1% | 96.9% |
| 2010 | 63,304 | 3.0% | 97.0% |
Nativity & Citizenship FAQs for Spalding County, Georgia
Approximately 4.1% of residents in Spalding County, Georgia were born outside the United States.
The vast majority of residents, roughly 97.8%, are U.S. citizens (including both native-born and naturalized citizens).