Whitfield County, Georgia Nativity & Citizenship Status (2024)
Place of birth and citizenship status analysis for Whitfield County, Georgia
Whitfield County, Georgia Nativity & Citizenship Indicators (2024)
Native Born
81.5%
Foreign Born
18.5%
Naturalized
7.0%
US Citizens
88.5%
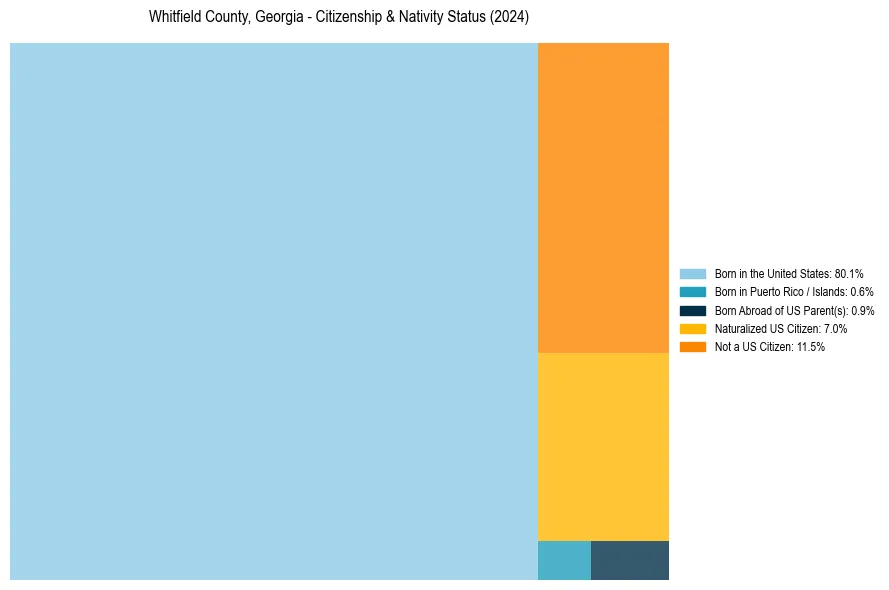
Whitfield County, Georgia Nativity & Citizenship Distribution
Whitfield County, Georgia Historical Nativity Trends (2010–2024)
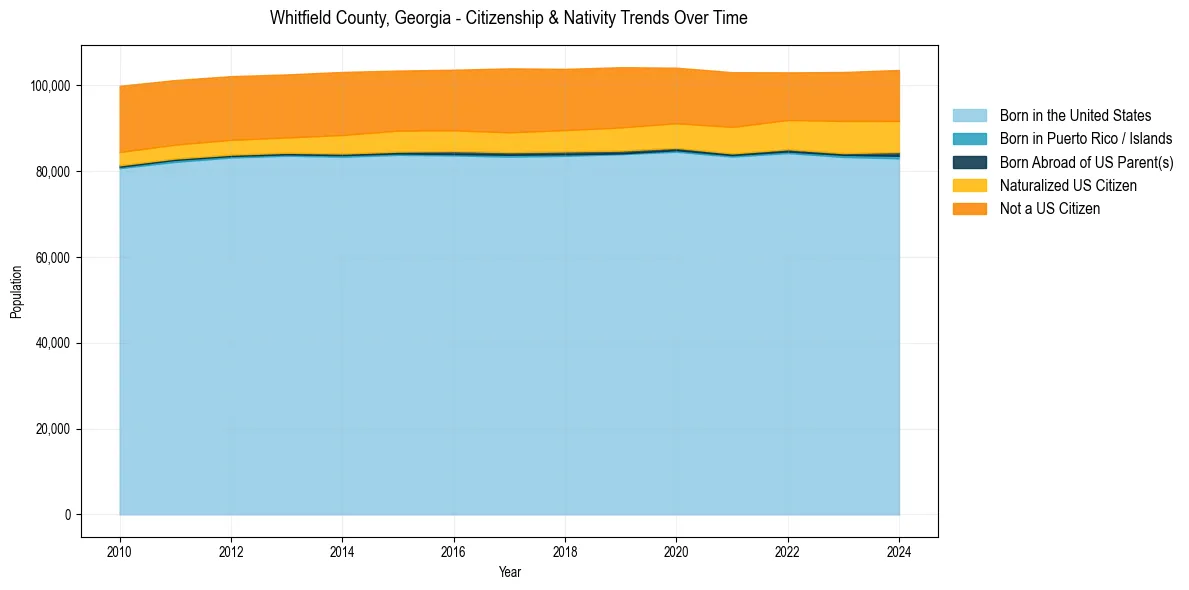
Whitfield County, Georgia Population & Nativity History
| Year | Total Pop | Foreign Born | Native Born |
|---|---|---|---|
| 2024 | 103,598 | 18.5% | 81.5% |
| 2023 | 103,118 | 18.3% | 81.7% |
| 2022 | 103,033 | 17.4% | 82.6% |
| 2021 | 103,076 | 18.4% | 81.6% |
| 2020 | 104,122 | 18.0% | 82.0% |
| 2019 | 104,237 | 18.7% | 81.3% |
| 2018 | 103,849 | 18.5% | 81.5% |
| 2017 | 103,963 | 18.8% | 81.2% |
| 2016 | 103,653 | 18.3% | 81.7% |
| 2015 | 103,456 | 18.3% | 81.7% |
| 2014 | 103,132 | 18.4% | 81.6% |
| 2013 | 102,556 | 17.8% | 82.2% |
| 2012 | 102,152 | 17.9% | 82.1% |
| 2011 | 101,234 | 18.1% | 81.9% |
| 2010 | 99,910 | 18.6% | 81.4% |
Nativity & Citizenship FAQs for Whitfield County, Georgia
Approximately 18.5% of residents in Whitfield County, Georgia were born outside the United States.
The vast majority of residents, roughly 88.5%, are U.S. citizens (including both native-born and naturalized citizens).