Hawaii County, Hawaii Nativity & Citizenship Status (2024)
Place of birth and citizenship status analysis for Hawaii County, Hawaii
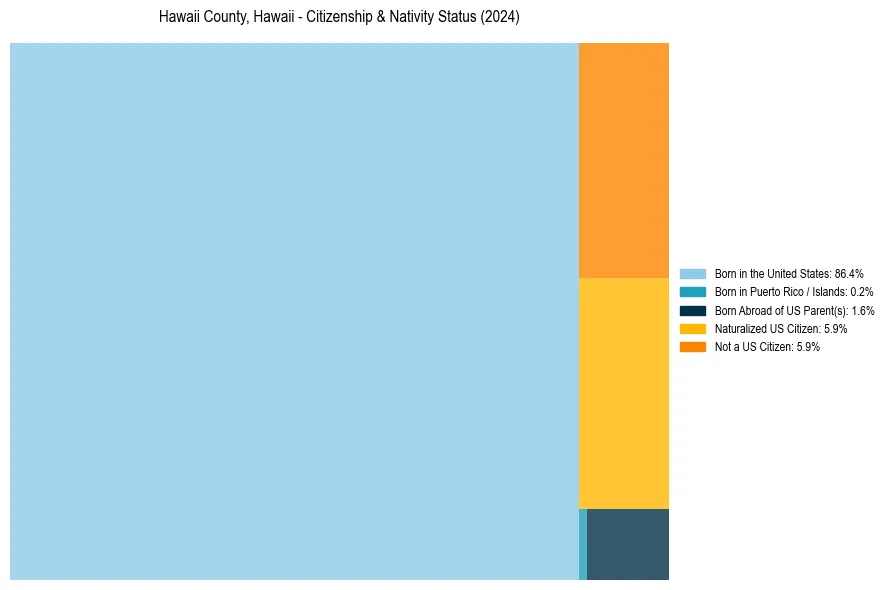
Hawaii County, Hawaii Nativity & Citizenship Indicators (2024)
Native Born
88.2%
Foreign Born
11.8%
Naturalized
5.9%
US Citizens
94.1%
Hawaii County, Hawaii Nativity & Citizenship Distribution
Hawaii County, Hawaii Historical Nativity Trends (2010–2024)
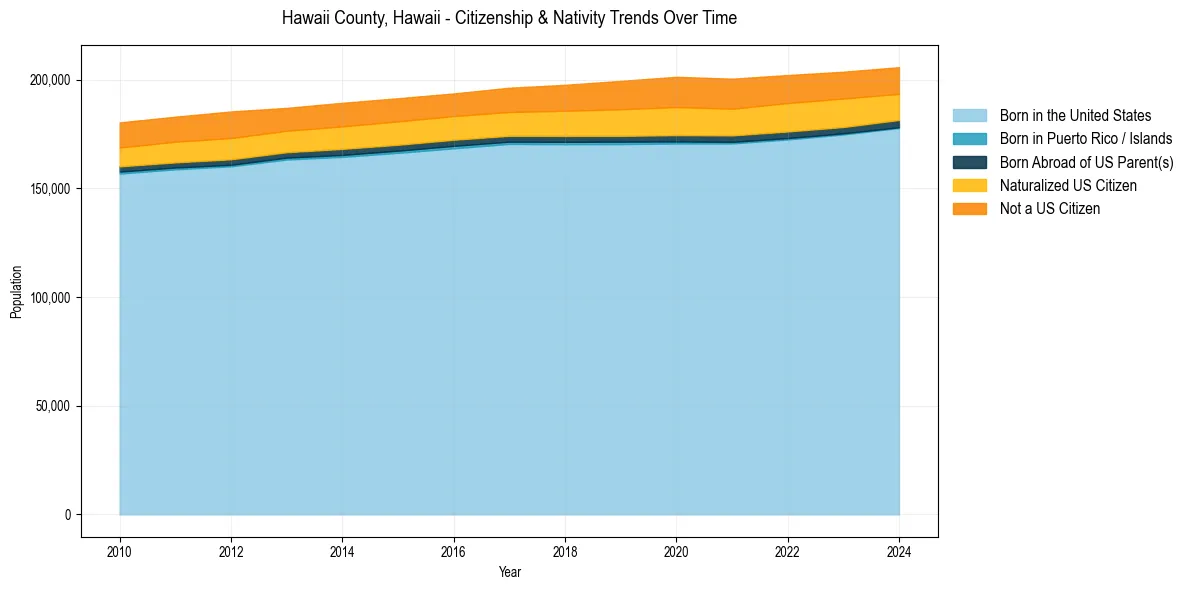
Hawaii County, Hawaii Population & Nativity History
| Year | Total Pop | Foreign Born | Native Born |
|---|---|---|---|
| 2024 | 205,769 | 11.8% | 88.2% |
| 2023 | 203,684 | 12.5% | 87.5% |
| 2022 | 202,163 | 12.9% | 87.1% |
| 2021 | 200,468 | 13.0% | 87.0% |
| 2020 | 201,350 | 13.3% | 86.7% |
| 2019 | 199,459 | 12.7% | 87.3% |
| 2018 | 197,658 | 11.9% | 88.1% |
| 2017 | 196,325 | 11.3% | 88.7% |
| 2016 | 193,680 | 11.0% | 89.0% |
| 2015 | 191,482 | 11.2% | 88.8% |
| 2014 | 189,382 | 11.2% | 88.8% |
| 2013 | 187,044 | 10.9% | 89.1% |
| 2012 | 185,399 | 11.9% | 88.1% |
| 2011 | 182,997 | 11.5% | 88.5% |
| 2010 | 180,362 | 11.2% | 88.8% |
Nativity & Citizenship FAQs for Hawaii County, Hawaii
Approximately 11.8% of residents in Hawaii County, Hawaii were born outside the United States.
The vast majority of residents, roughly 94.1%, are U.S. citizens (including both native-born and naturalized citizens).