United States Health Insurance Coverage (2024)
Detailed analysis of uninsured rates and coverage trends for the United States
Universe
329,980,753
Total Uninsured
27,734,911
Uninsured Rate
8.4%
Coverage by Age and Gender
Distribution of insured vs. uninsured residents in United States
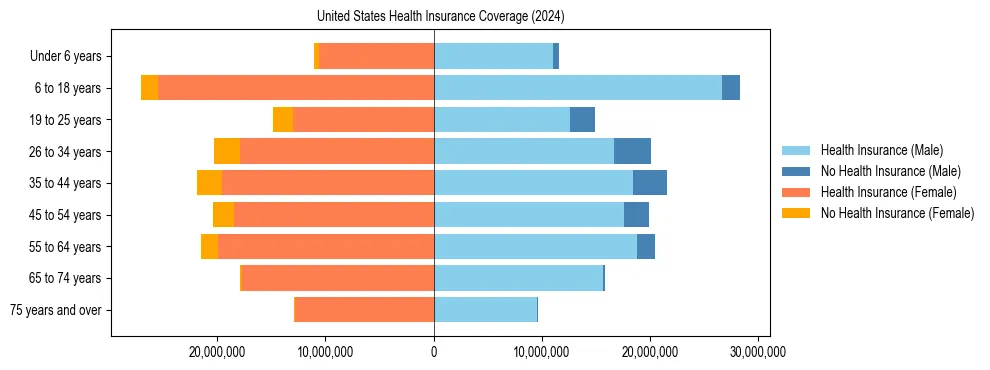
Uninsured Rates by Demographic Group
Under 18 Years
Male Uninsured5.5%
Female Uninsured5.4%
18 to 34 Years
Male Uninsured16.6%
Female Uninsured12.0%
35 to 64 Years
Male Uninsured11.5%
Female Uninsured9.2%
65 Years & Over
Male Uninsured0.9%
Female Uninsured0.8%
Uninsured Rate Trends
Historical coverage data from 2012 to 2024
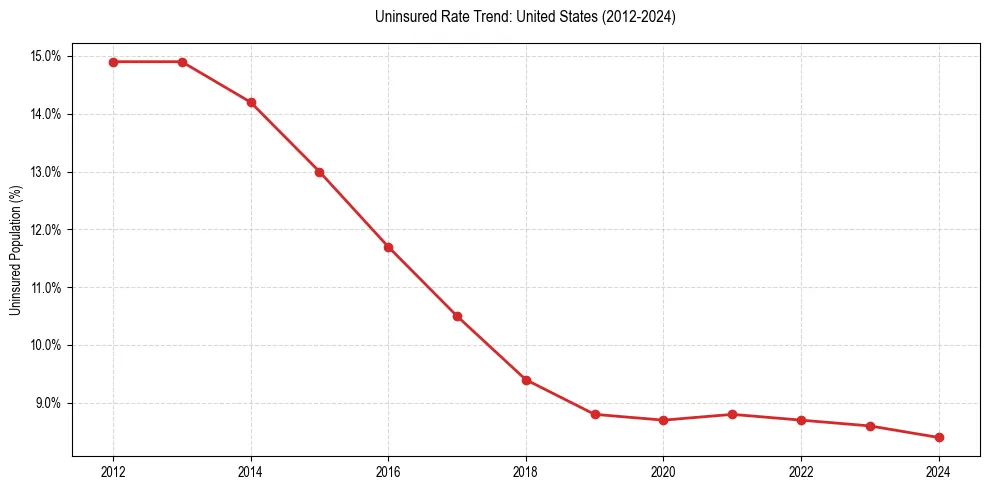
| Year | Total Uninsured | Uninsured Rate |
|---|---|---|
| 2024 | 27,734,911 | 8.4% |
| 2023 | 28,000,876 | 8.6% |
| 2022 | 28,315,092 | 8.7% |
| 2021 | 28,489,142 | 8.8% |
| 2020 | 28,058,903 | 8.7% |
| 2019 | 28,248,613 | 8.8% |
| 2018 | 29,752,767 | 9.4% |
| 2017 | 33,177,146 | 10.5% |
| 2016 | 36,700,246 | 11.7% |
| 2015 | 40,446,231 | 13.0% |
| 2014 | 43,878,131 | 14.2% |
| 2013 | 45,569,665 | 14.9% |
| 2012 | 45,206,153 | 14.9% |
Frequently Asked Questions
Approximately 8.4% of the population in the United States does not have health insurance coverage.
In the United States, young adult males (18-34) face the highest barrier to coverage, with an uninsured rate of 16.6%. This is notably higher than the overall local average of 8.4%.