Latah County, Idaho Nativity & Citizenship Status (2024)
Place of birth and citizenship status analysis for Latah County, Idaho
Latah County, Idaho Nativity & Citizenship Indicators (2024)
Native Born
96.1%
Foreign Born
3.9%
Naturalized
1.7%
US Citizens
97.9%
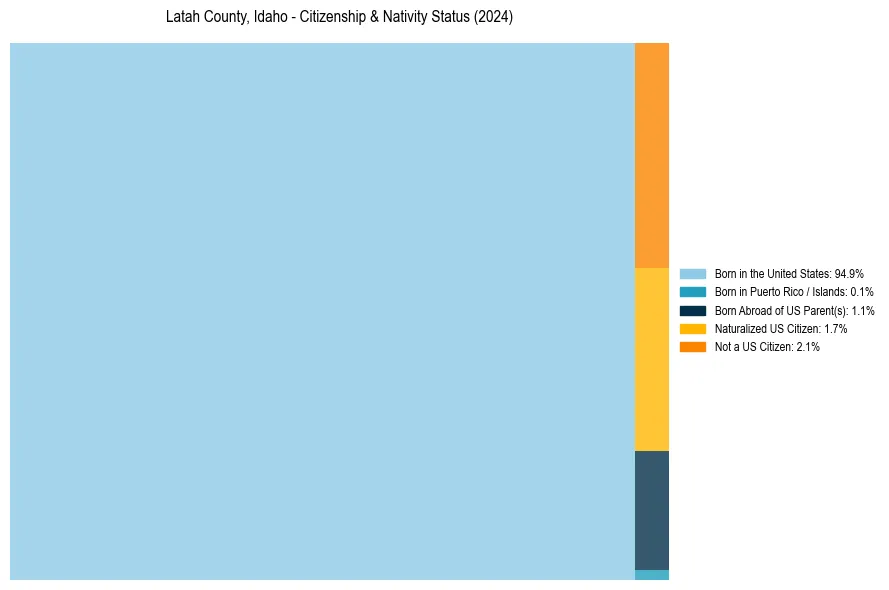
Latah County, Idaho Nativity & Citizenship Distribution
Latah County, Idaho Historical Nativity Trends (2010–2024)
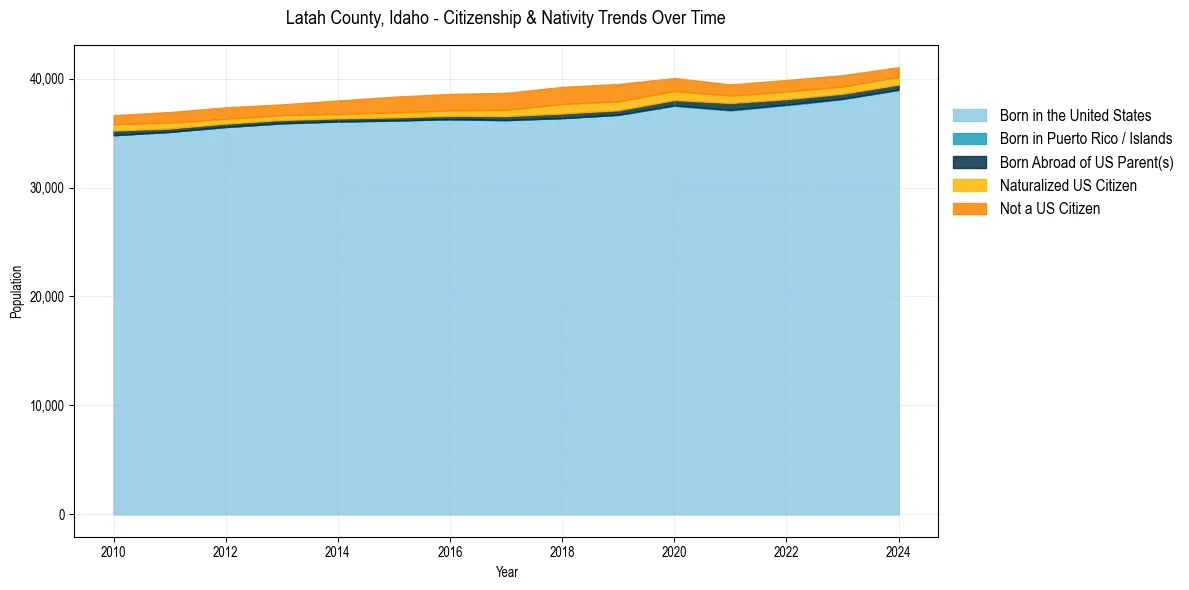
Latah County, Idaho Population & Nativity History
| Year | Total Pop | Foreign Born | Native Born |
|---|---|---|---|
| 2024 | 41,049 | 3.9% | 96.1% |
| 2023 | 40,315 | 4.2% | 95.8% |
| 2022 | 39,872 | 4.4% | 95.6% |
| 2021 | 39,464 | 4.3% | 95.7% |
| 2020 | 40,052 | 5.0% | 95.0% |
| 2019 | 39,505 | 6.1% | 93.9% |
| 2018 | 39,239 | 6.2% | 93.8% |
| 2017 | 38,697 | 5.5% | 94.5% |
| 2016 | 38,593 | 5.2% | 94.8% |
| 2015 | 38,339 | 5.0% | 95.0% |
| 2014 | 37,989 | 4.3% | 95.7% |
| 2013 | 37,636 | 3.8% | 96.2% |
| 2012 | 37,365 | 4.0% | 96.0% |
| 2011 | 36,932 | 4.1% | 95.9% |
| 2010 | 36,645 | 3.9% | 96.1% |
Nativity & Citizenship FAQs for Latah County, Idaho
Approximately 3.9% of residents in Latah County, Idaho were born outside the United States.
The vast majority of residents, roughly 97.9%, are U.S. citizens (including both native-born and naturalized citizens).