Lemhi County, Idaho Race & Ethnicity Demographics (2024)
Racial distribution and diversity statistics for Lemhi County, Idaho
Lemhi County, Idaho Diversity Indicators (2024)
Total Population
8,249
Diversity Score
16.1
Diversity Tier
Low
Largest Group
White (Non-Hispanic)
91.5%%
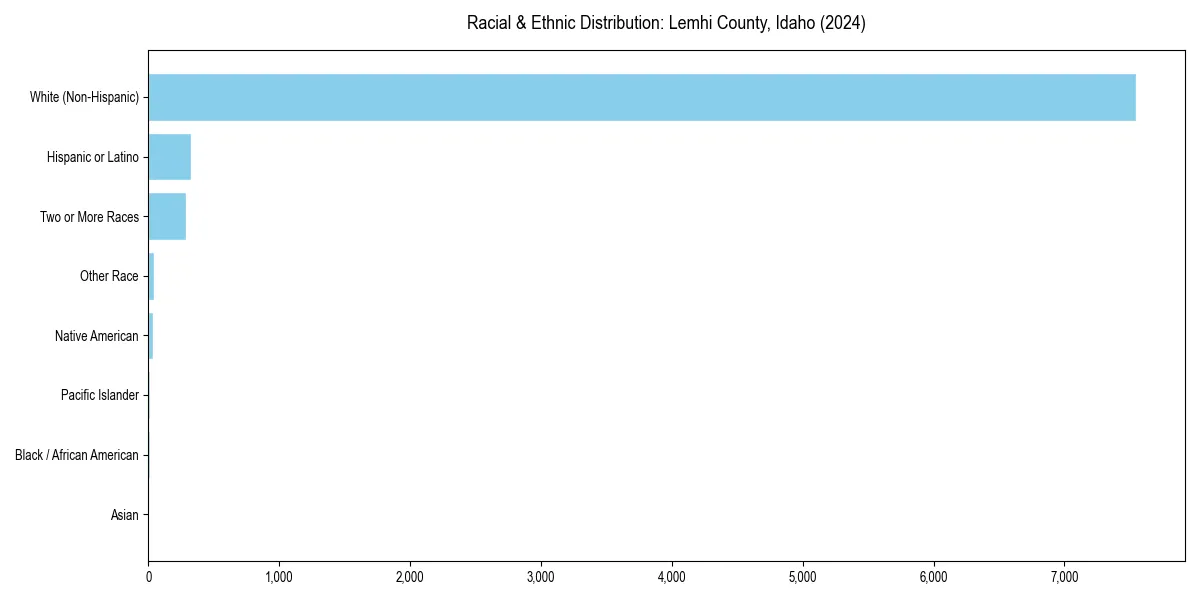
Lemhi County, Idaho Racial & Ethnic Breakdown
Lemhi County, Idaho Historical Diversity Trend (2010–2024)
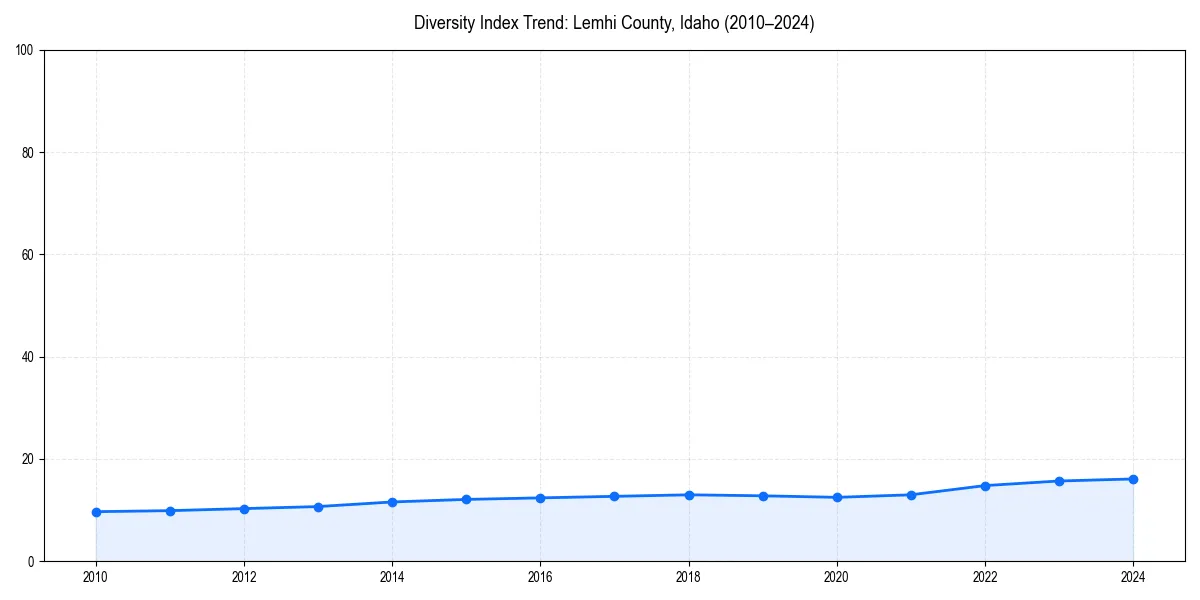
Since 2010, the diversity index of Lemhi County, Idaho has increased significantly.
Lemhi County, Idaho Population by Race & Ethnicity
| Race / Ethnicity | Population | Percentage |
|---|---|---|
| White (Non-Hispanic) | 7,544 | 91.5% |
| Hispanic or Latino | 324 | 3.9% |
| Two or More Races | 286 | 3.5% |
| Other Race | 40 | 0.5% |
| Native American | 34 | 0.4% |
| Pacific Islander | 10 | 0.1% |
| Black / African American | 8 | 0.1% |
| Asian | 3 | 0.0% |
Diversity & Demographics FAQs for Lemhi County, Idaho
The largest racial or ethnic group in Lemhi County, Idaho is White (Non-Hispanic), which makes up 91.5% of the total population.
Since 2010, the diversity index for Lemhi County, Idaho has increased significantly. The area currently has a diversity score of 16.1/100, which is considered a Low level of diversity.