Illinois Age & Gender Distribution (2024)
Population distribution by age and gender for Illinois
Illinois Age & Gender Statistics (2024)
Total Population
12,694,798
Median Age
39.0
Male Median
38.0
Female Median
40.0
Illinois Population Growth
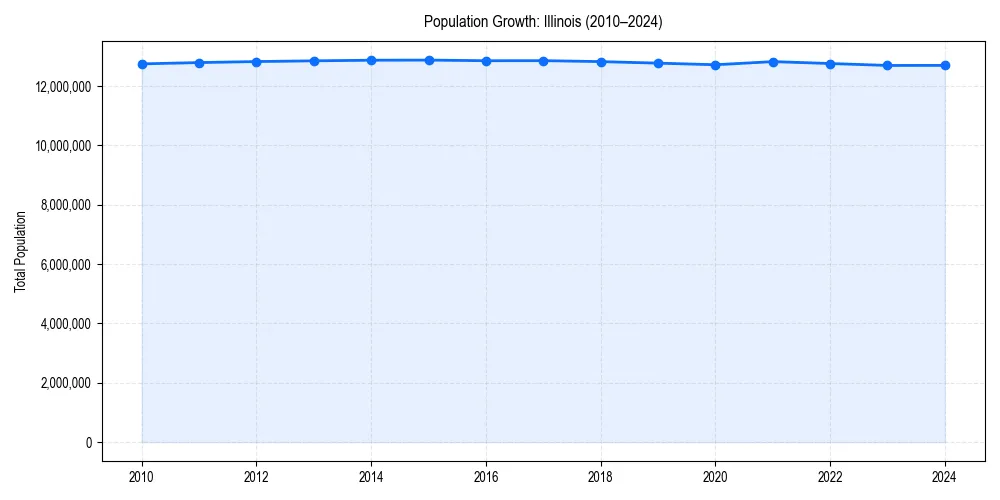
Illinois Demographic Trend
Since 2010, the population of has changed by -0.4%%.
-0.4%% Growth
Illinois Age & Gender Pyramid
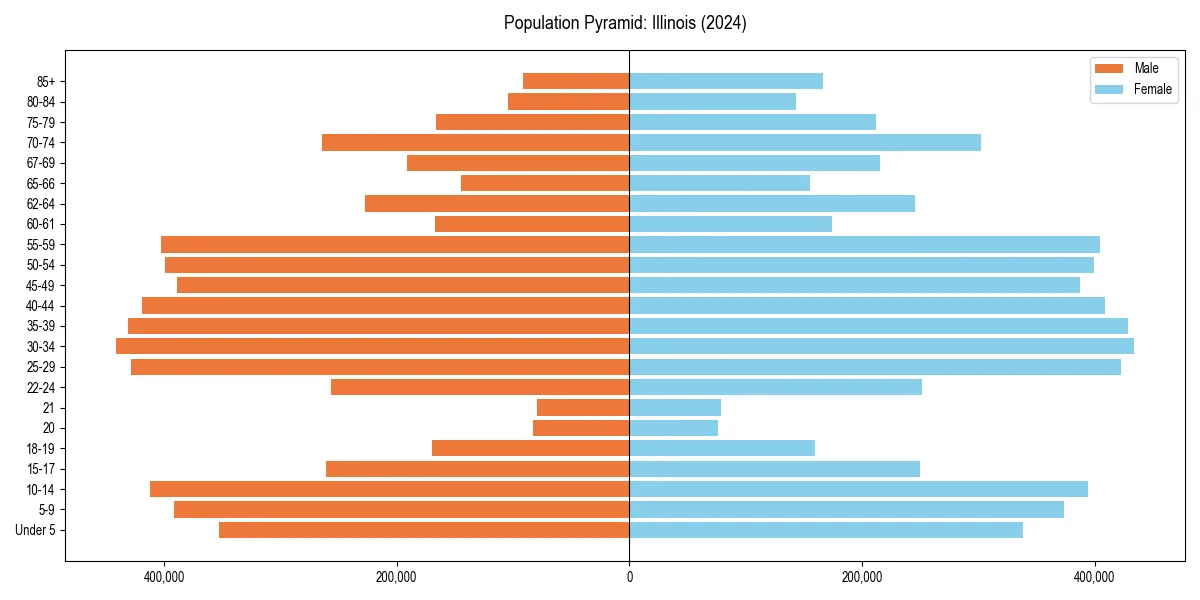
Figure 2: Population distribution by age and gender for 2024.
Illinois Historical Population Data
| Year | Median Age | Population |
|---|---|---|
| 2024 | 39.0 | 12,694,798 |
| 2023 | 38.9 | 12,692,653 |
| 2022 | 38.7 | 12,757,634 |
| 2021 | 38.5 | 12,821,813 |
| 2020 | 38.3 | 12,716,164 |
| 2019 | 38.1 | 12,770,631 |
| 2018 | 37.9 | 12,821,497 |
| 2017 | 37.7 | 12,854,526 |
| 2016 | 37.4 | 12,851,684 |
| 2015 | 37.3 | 12,873,761 |
| 2014 | 37.0 | 12,868,747 |
| 2013 | 36.8 | 12,848,554 |
| 2012 | 36.6 | 12,823,860 |
| 2011 | 36.4 | 12,790,182 |
| 2010 | 36.2 | 12,745,359 |
Illinois Age Group Breakdown (2024)
| Age Cohort | Percentage |
|---|---|
| Under 5 | 5.4% |
| 5–17 | 16.4% |
| 18–24 | 9.1% |
| 25–34 | 13.6% |
| 35–54 | 25.7% |
| 55–64 | 12.8% |
| 65+ | 17.0% |
Dependency Ratios for Illinois
- Total Dependency Ratio:
- 63.5
- Youth Dependency:
- 35.7
- Old-Age Dependency:
- 27.8
The dependency ratio measures dependents (ages 0-17 and 65+) per 100 working-age individuals (ages 18-64).
Age & Gender FAQs for Illinois
The median age in Illinois is 39.0 years.
According to latest Census data, the total population of Illinois is 12,694,798.
In Illinois, seniors (ages 65+) make up 17.0% of the population, while children under 18 represent 16.4%.
Based on historical data since 2010, the population in Illinois is aging.