Indiana Age & Gender Distribution (2024)
Population distribution by age and gender for Indiana
Indiana Age & Gender Statistics (2024)
Total Population
6,851,073
Median Age
38.1
Male Median
37.0
Female Median
39.1
Indiana Population Growth
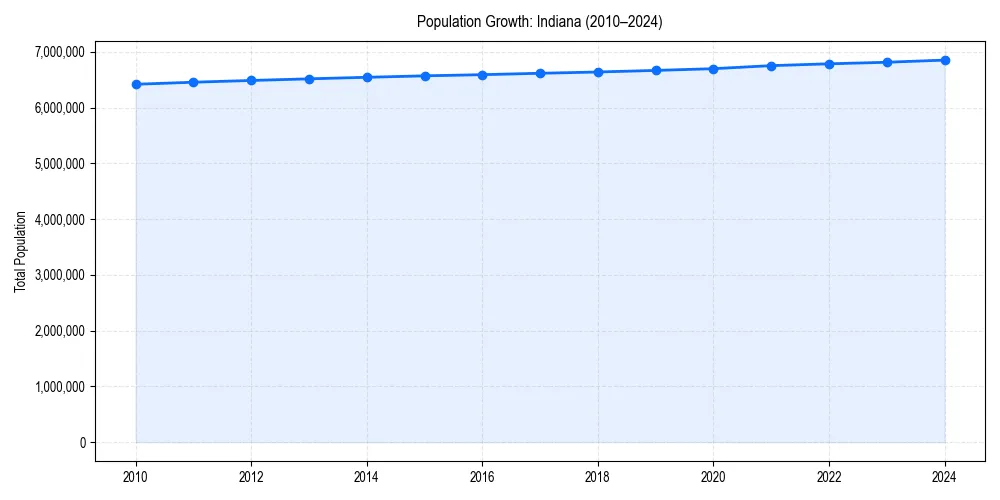
Indiana Demographic Trend
Since 2010, the population of has changed by +6.8%%.
+6.8%% Growth
Indiana Age & Gender Pyramid
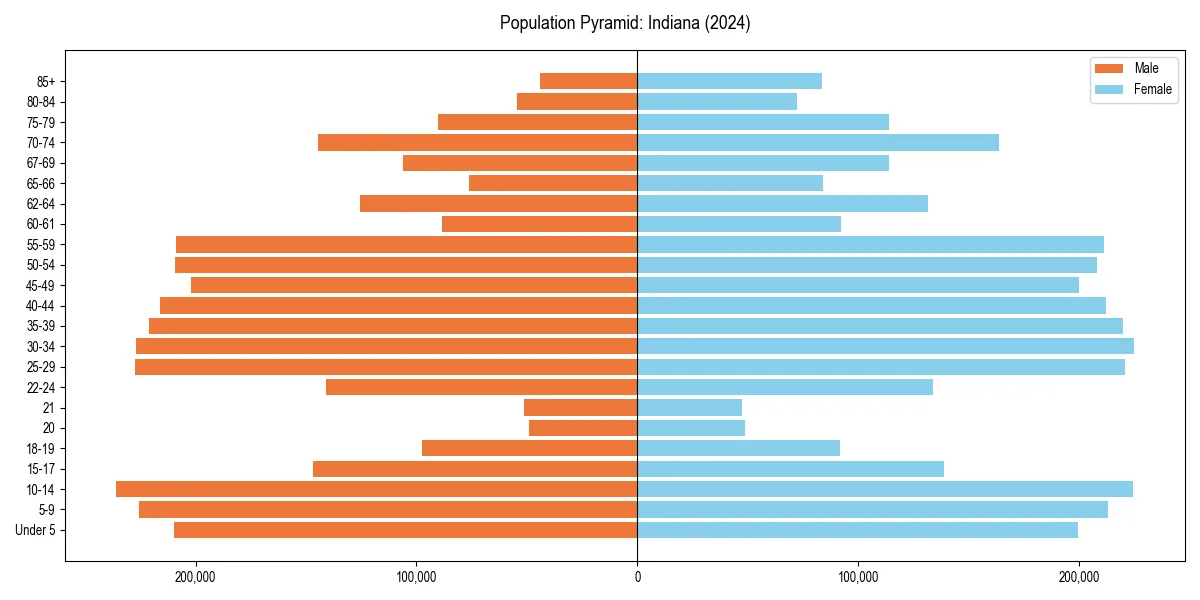
Figure 2: Population distribution by age and gender for 2024.
Indiana Historical Population Data
| Year | Median Age | Population |
|---|---|---|
| 2024 | 38.1 | 6,851,073 |
| 2023 | 38.0 | 6,811,752 |
| 2022 | 38.0 | 6,784,403 |
| 2021 | 37.9 | 6,751,340 |
| 2020 | 37.8 | 6,696,893 |
| 2019 | 37.7 | 6,665,703 |
| 2018 | 37.6 | 6,637,426 |
| 2017 | 37.5 | 6,614,418 |
| 2016 | 37.4 | 6,589,578 |
| 2015 | 37.3 | 6,568,645 |
| 2014 | 37.2 | 6,542,411 |
| 2013 | 37.1 | 6,514,861 |
| 2012 | 37.0 | 6,485,530 |
| 2011 | 36.8 | 6,454,254 |
| 2010 | 36.6 | 6,417,398 |
Indiana Age Group Breakdown (2024)
| Age Cohort | Percentage |
|---|---|
| Under 5 | 6.0% |
| 5–17 | 17.3% |
| 18–24 | 9.6% |
| 25–34 | 13.1% |
| 35–54 | 24.7% |
| 55–64 | 12.5% |
| 65+ | 16.8% |
Dependency Ratios for Indiana
- Total Dependency Ratio:
- 66.7
- Youth Dependency:
- 38.8
- Old-Age Dependency:
- 27.9
The dependency ratio measures dependents (ages 0-17 and 65+) per 100 working-age individuals (ages 18-64).
Age & Gender FAQs for Indiana
The median age in Indiana is 38.1 years.
According to latest Census data, the total population of Indiana is 6,851,073.
In Indiana, seniors (ages 65+) make up 16.8% of the population, while children under 18 represent 17.3%.
Based on historical data since 2010, the population in Indiana has remained stable.