Iowa Age & Gender Distribution (2024)
Population distribution by age and gender for Iowa
Iowa Age & Gender Statistics (2024)
Total Population
3,210,507
Median Age
38.6
Male Median
37.8
Female Median
39.6
Iowa Population Growth
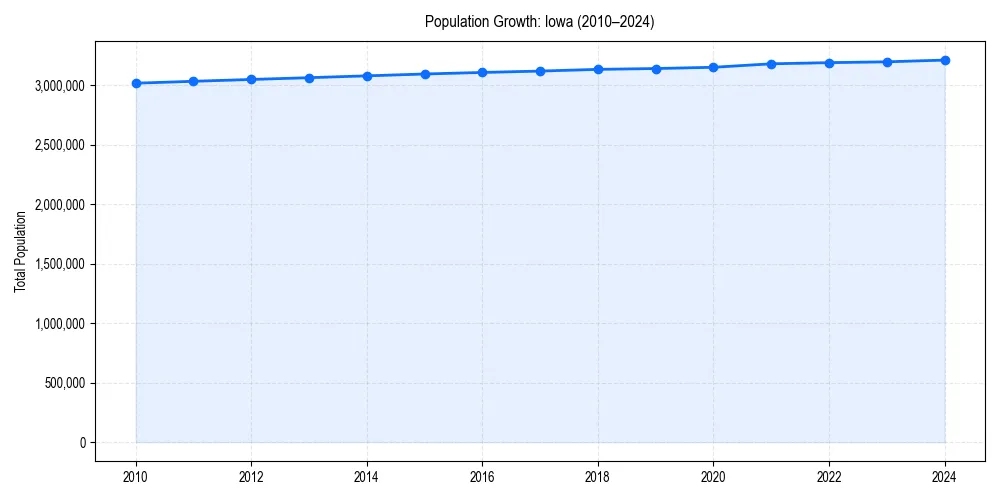
Iowa Demographic Trend
Since 2010, the population of has changed by +6.4%%.
+6.4%% Growth
Iowa Age & Gender Pyramid
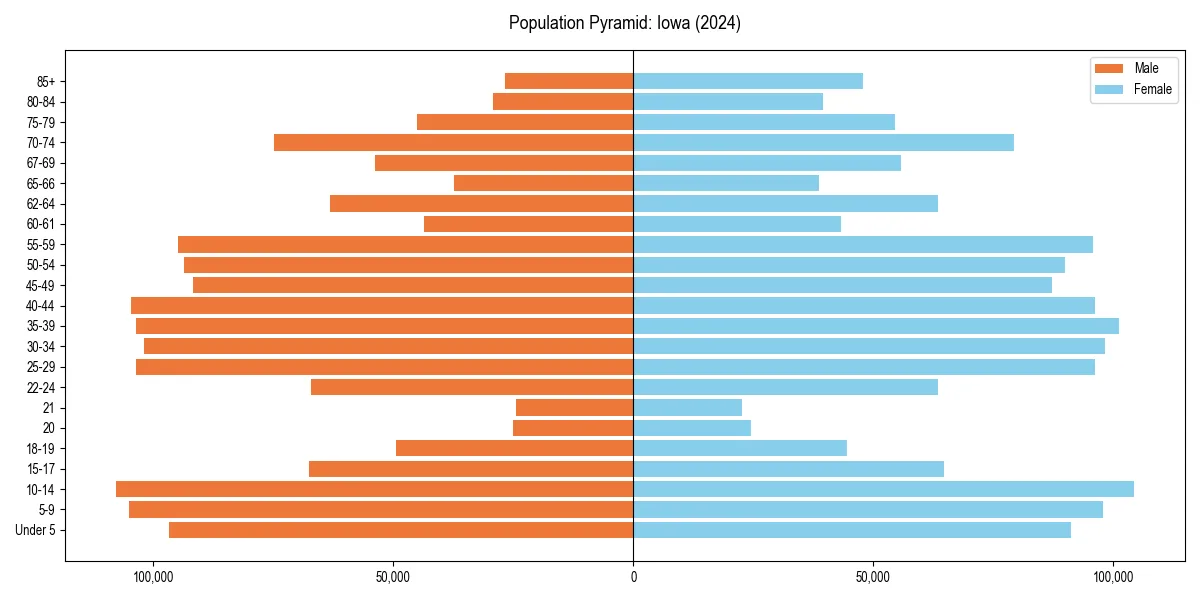
Figure 2: Population distribution by age and gender for 2024.
Iowa Historical Population Data
| Year | Median Age | Population |
|---|---|---|
| 2024 | 38.6 | 3,210,507 |
| 2023 | 38.6 | 3,195,937 |
| 2022 | 38.4 | 3,188,836 |
| 2021 | 38.3 | 3,179,090 |
| 2020 | 38.3 | 3,150,011 |
| 2019 | 38.2 | 3,139,508 |
| 2018 | 38.1 | 3,132,499 |
| 2017 | 38.1 | 3,118,102 |
| 2016 | 38.0 | 3,106,589 |
| 2015 | 38.1 | 3,093,526 |
| 2014 | 38.0 | 3,078,116 |
| 2013 | 38.1 | 3,062,553 |
| 2012 | 38.0 | 3,047,646 |
| 2011 | 38.0 | 3,032,266 |
| 2010 | 38.0 | 3,016,267 |
Iowa Age Group Breakdown (2024)
| Age Cohort | Percentage |
|---|---|
| Under 5 | 5.9% |
| 5–17 | 17.0% |
| 18–24 | 10.0% |
| 25–34 | 12.5% |
| 35–54 | 23.9% |
| 55–64 | 12.6% |
| 65+ | 18.1% |
Dependency Ratios for Iowa
- Total Dependency Ratio:
- 69.6
- Youth Dependency:
- 38.8
- Old-Age Dependency:
- 30.7
The dependency ratio measures dependents (ages 0-17 and 65+) per 100 working-age individuals (ages 18-64).
Age & Gender FAQs for Iowa
The median age in Iowa is 38.6 years.
According to latest Census data, the total population of Iowa is 3,210,507.
In Iowa, seniors (ages 65+) make up 18.1% of the population, while children under 18 represent 17.0%.
Based on historical data since 2010, the population in Iowa has remained stable.