Scott County, Iowa Nativity & Citizenship Status (2024)
Place of birth and citizenship status analysis for Scott County, Iowa
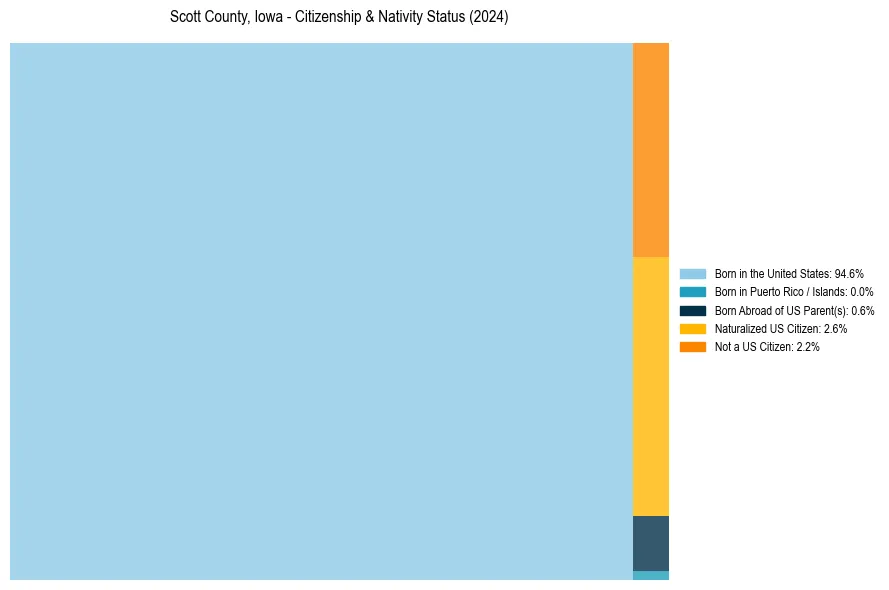
Scott County, Iowa Nativity & Citizenship Indicators (2024)
Native Born
95.2%
Foreign Born
4.8%
Naturalized
2.6%
US Citizens
97.8%
Scott County, Iowa Nativity & Citizenship Distribution
Scott County, Iowa Historical Nativity Trends (2010–2024)
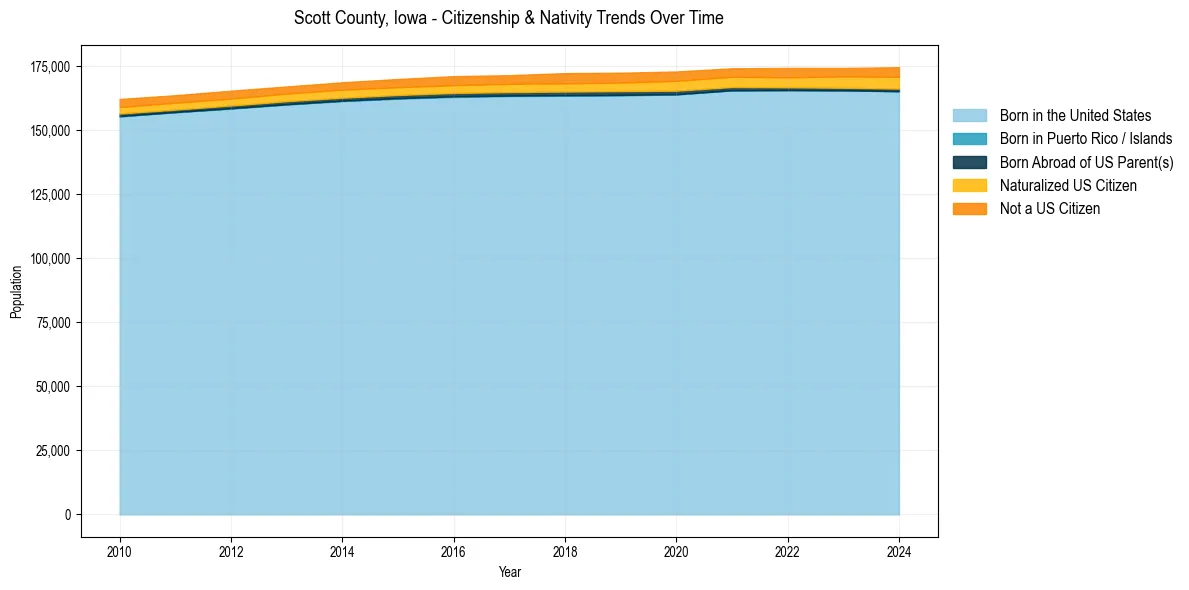
Scott County, Iowa Population & Nativity History
| Year | Total Pop | Foreign Born | Native Born |
|---|---|---|---|
| 2024 | 174,608 | 4.8% | 95.2% |
| 2023 | 174,302 | 4.4% | 95.6% |
| 2022 | 174,315 | 4.3% | 95.7% |
| 2021 | 174,170 | 4.2% | 95.8% |
| 2020 | 172,938 | 4.3% | 95.7% |
| 2019 | 172,446 | 4.2% | 95.8% |
| 2018 | 172,288 | 4.2% | 95.8% |
| 2017 | 171,493 | 3.9% | 96.1% |
| 2016 | 171,116 | 3.8% | 96.2% |
| 2015 | 169,994 | 3.7% | 96.3% |
| 2014 | 168,714 | 3.6% | 96.4% |
| 2013 | 167,080 | 3.4% | 96.6% |
| 2012 | 165,432 | 3.5% | 96.5% |
| 2011 | 163,667 | 3.4% | 96.6% |
| 2010 | 162,184 | 3.5% | 96.5% |
Nativity & Citizenship FAQs for Scott County, Iowa
Approximately 4.8% of residents in Scott County, Iowa were born outside the United States.
The vast majority of residents, roughly 97.8%, are U.S. citizens (including both native-born and naturalized citizens).