Kentucky Age & Gender Distribution (2024)
Population distribution by age and gender for Kentucky
Kentucky Age & Gender Statistics (2024)
Total Population
4,534,824
Median Age
39.1
Male Median
37.9
Female Median
40.3
Kentucky Population Growth
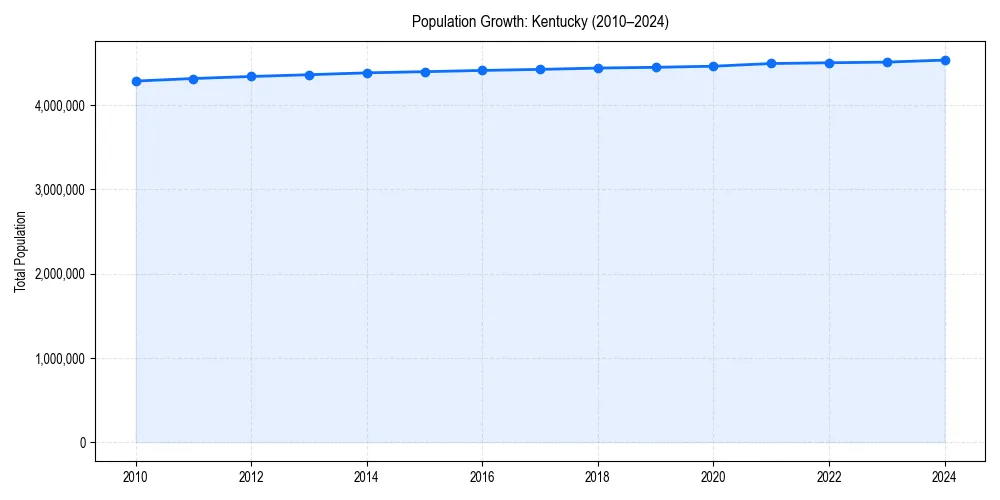
Kentucky Demographic Trend
Since 2010, the population of has changed by +5.8%%.
+5.8%% Growth
Kentucky Age & Gender Pyramid
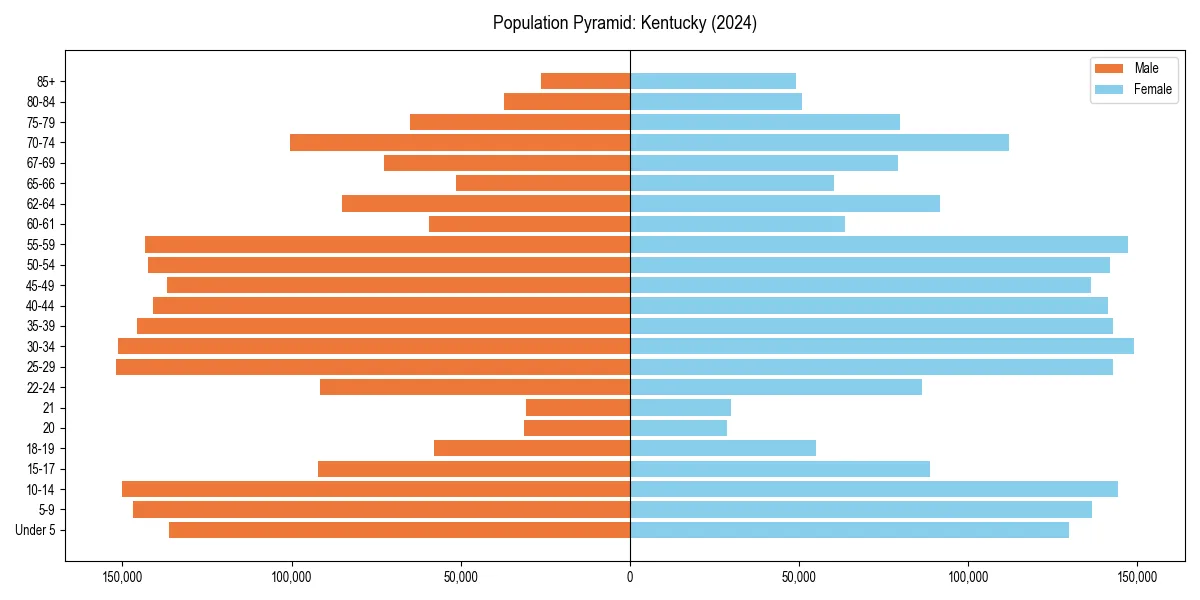
Figure 2: Population distribution by age and gender for 2024.
Kentucky Historical Population Data
| Year | Median Age | Population |
|---|---|---|
| 2024 | 39.1 | 4,534,824 |
| 2023 | 39.1 | 4,510,725 |
| 2022 | 39.1 | 4,502,935 |
| 2021 | 39.0 | 4,494,141 |
| 2020 | 39.0 | 4,461,952 |
| 2019 | 38.9 | 4,449,052 |
| 2018 | 38.7 | 4,440,204 |
| 2017 | 38.6 | 4,424,376 |
| 2016 | 38.6 | 4,411,989 |
| 2015 | 38.5 | 4,397,353 |
| 2014 | 38.3 | 4,383,272 |
| 2013 | 38.2 | 4,361,333 |
| 2012 | 38.0 | 4,340,167 |
| 2011 | 37.8 | 4,316,040 |
| 2010 | 37.7 | 4,285,828 |
Kentucky Age Group Breakdown (2024)
| Age Cohort | Percentage |
|---|---|
| Under 5 | 5.9% |
| 5–17 | 16.7% |
| 18–24 | 9.1% |
| 25–34 | 13.1% |
| 35–54 | 24.9% |
| 55–64 | 13.0% |
| 65+ | 17.3% |
Dependency Ratios for Kentucky
- Total Dependency Ratio:
- 66.4
- Youth Dependency:
- 37.6
- Old-Age Dependency:
- 28.8
The dependency ratio measures dependents (ages 0-17 and 65+) per 100 working-age individuals (ages 18-64).
Age & Gender FAQs for Kentucky
The median age in Kentucky is 39.1 years.
According to latest Census data, the total population of Kentucky is 4,534,824.
In Kentucky, seniors (ages 65+) make up 17.3% of the population, while children under 18 represent 16.7%.
Based on historical data since 2010, the population in Kentucky has remained stable.