Fleming County, Kentucky Nativity & Citizenship Status (2024)
Place of birth and citizenship status analysis for Fleming County, Kentucky
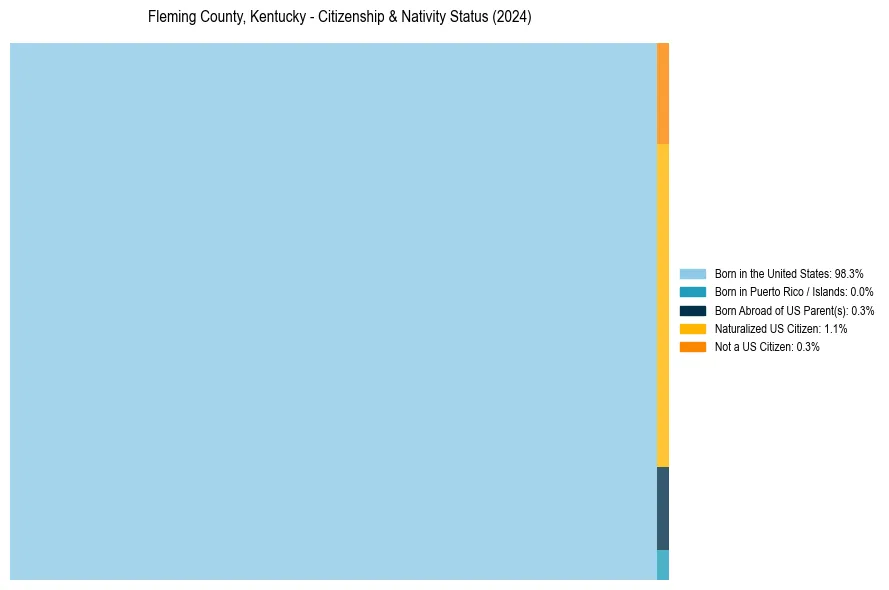
Fleming County, Kentucky Nativity & Citizenship Indicators (2024)
Native Born
98.6%
Foreign Born
1.4%
Naturalized
1.1%
US Citizens
99.7%
Fleming County, Kentucky Nativity & Citizenship Distribution
Fleming County, Kentucky Historical Nativity Trends (2010–2024)
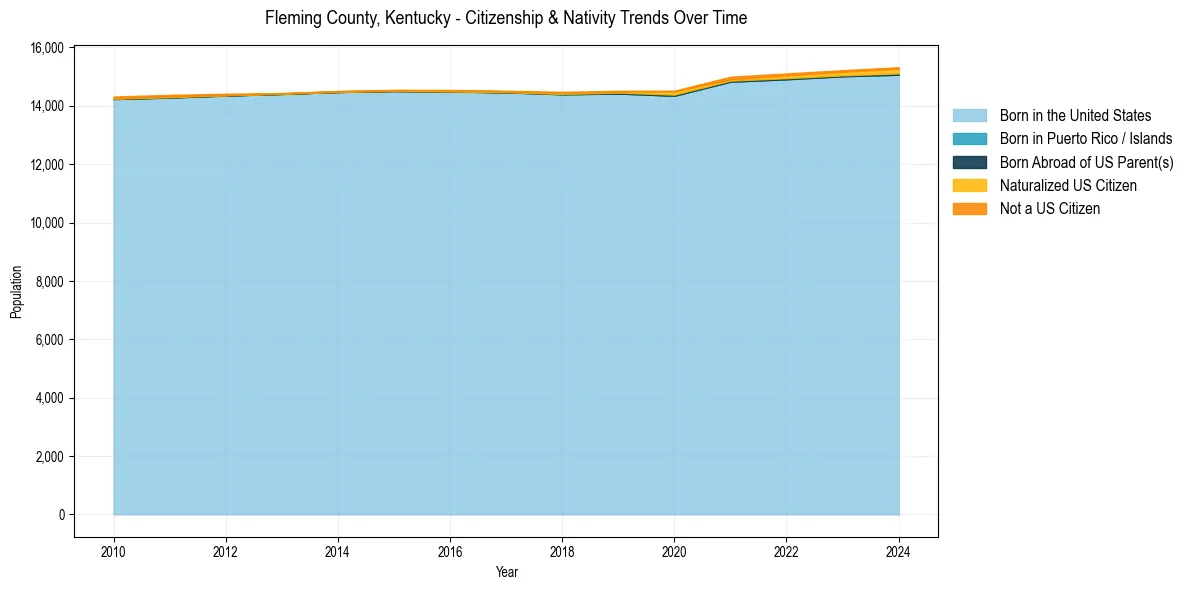
Fleming County, Kentucky Population & Nativity History
| Year | Total Pop | Foreign Born | Native Born |
|---|---|---|---|
| 2024 | 15,323 | 1.4% | 98.6% |
| 2023 | 15,221 | 1.2% | 98.8% |
| 2022 | 15,111 | 1.1% | 98.9% |
| 2021 | 14,996 | 0.9% | 99.1% |
| 2020 | 14,519 | 1.0% | 99.0% |
| 2019 | 14,513 | 0.4% | 99.6% |
| 2018 | 14,479 | 0.5% | 99.5% |
| 2017 | 14,515 | 0.3% | 99.7% |
| 2016 | 14,543 | 0.4% | 99.6% |
| 2015 | 14,544 | 0.2% | 99.8% |
| 2014 | 14,505 | 0.2% | 99.8% |
| 2013 | 14,435 | 0.2% | 99.8% |
| 2012 | 14,415 | 0.4% | 99.6% |
| 2011 | 14,376 | 0.6% | 99.4% |
| 2010 | 14,318 | 0.5% | 99.5% |
Nativity & Citizenship FAQs for Fleming County, Kentucky
Approximately 1.4% of residents in Fleming County, Kentucky were born outside the United States.
The vast majority of residents, roughly 99.7%, are U.S. citizens (including both native-born and naturalized citizens).