Jefferson County, Kentucky Nativity & Citizenship Status (2024)
Place of birth and citizenship status analysis for Jefferson County, Kentucky
Jefferson County, Kentucky Nativity & Citizenship Indicators (2024)
Native Born
90.0%
Foreign Born
10.0%
Naturalized
4.1%
US Citizens
94.1%
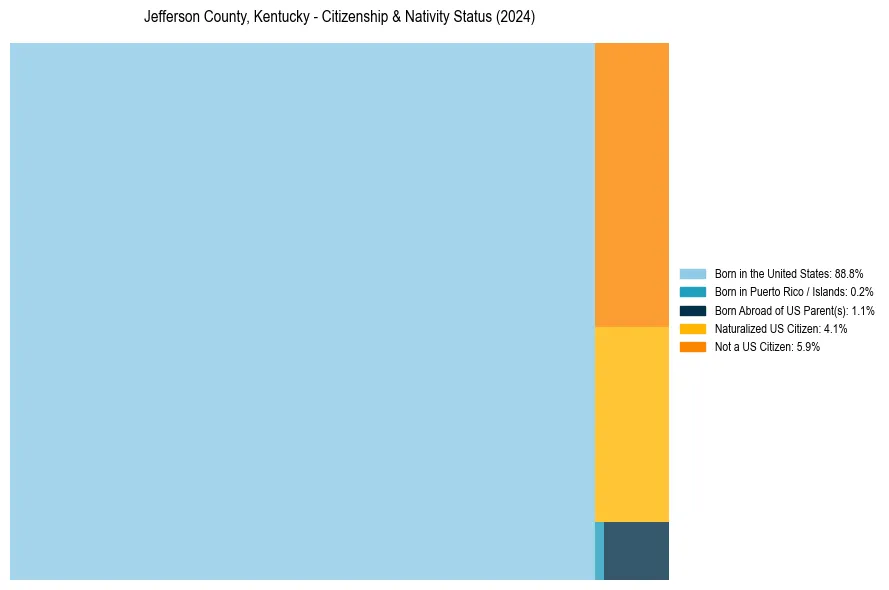
Jefferson County, Kentucky Nativity & Citizenship Distribution
Jefferson County, Kentucky Historical Nativity Trends (2010–2024)
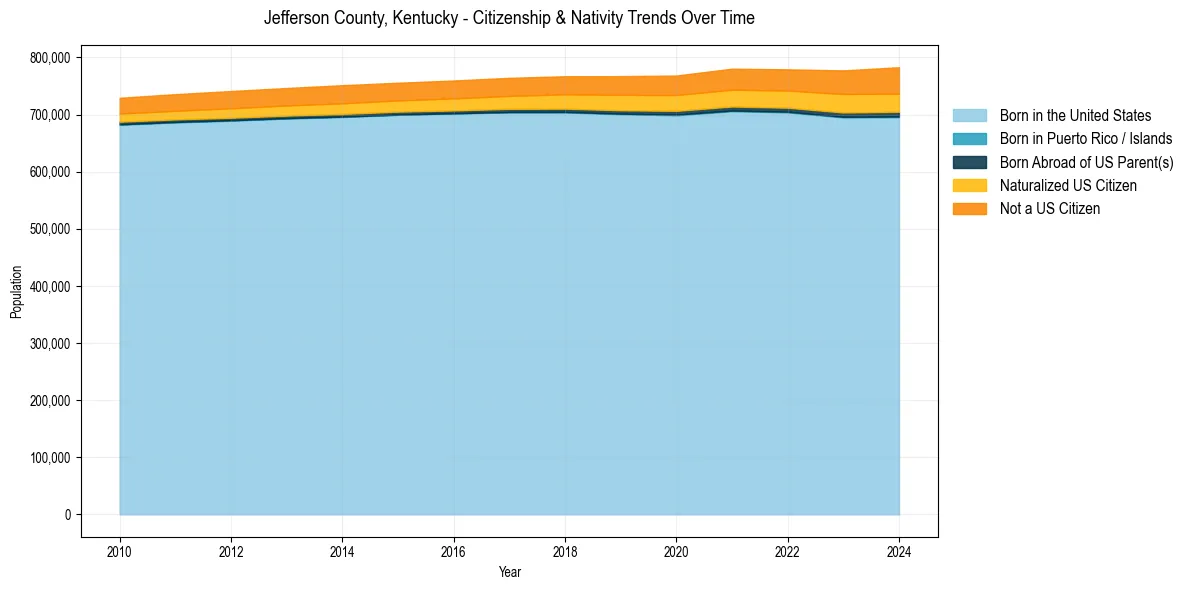
Jefferson County, Kentucky Population & Nativity History
| Year | Total Pop | Foreign Born | Native Born |
|---|---|---|---|
| 2024 | 783,022 | 10.0% | 90.0% |
| 2023 | 777,392 | 9.5% | 90.5% |
| 2022 | 779,232 | 8.6% | 91.4% |
| 2021 | 780,449 | 8.5% | 91.5% |
| 2020 | 768,419 | 8.1% | 91.9% |
| 2019 | 767,419 | 7.8% | 92.2% |
| 2018 | 767,154 | 7.4% | 92.6% |
| 2017 | 764,378 | 7.1% | 92.9% |
| 2016 | 759,724 | 6.9% | 93.1% |
| 2015 | 755,809 | 6.7% | 93.3% |
| 2014 | 751,485 | 6.7% | 93.3% |
| 2013 | 746,580 | 6.5% | 93.5% |
| 2012 | 741,285 | 6.3% | 93.7% |
| 2011 | 735,804 | 6.0% | 94.0% |
| 2010 | 729,452 | 5.7% | 94.3% |
Nativity & Citizenship FAQs for Jefferson County, Kentucky
Approximately 10.0% of residents in Jefferson County, Kentucky were born outside the United States.
The vast majority of residents, roughly 94.1%, are U.S. citizens (including both native-born and naturalized citizens).