Maine Age & Gender Distribution (2024)
Population distribution by age and gender for Maine
Maine Age & Gender Statistics (2024)
Total Population
1,387,817
Median Age
44.8
Male Median
43.5
Female Median
46.0
Maine Population Growth
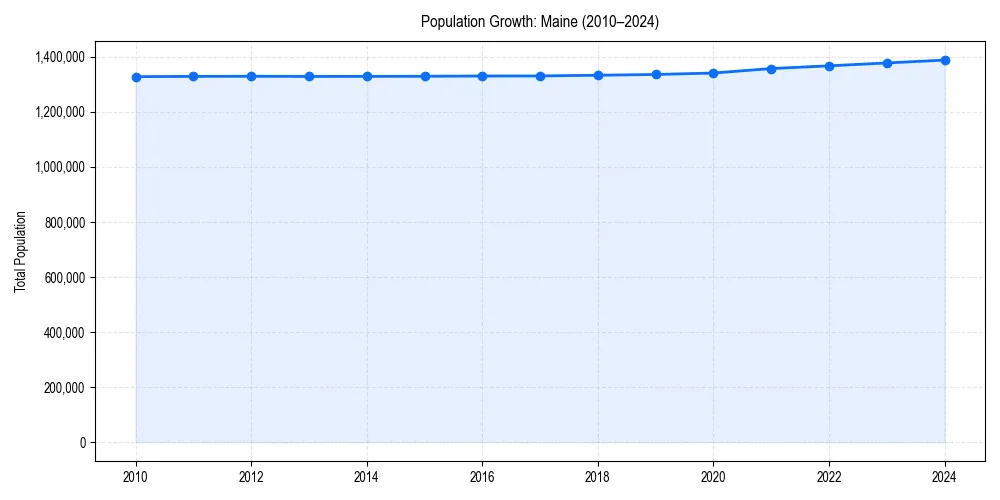
Maine Demographic Trend
Since 2010, the population of has changed by +4.5%%.
+4.5%% Growth
Maine Age & Gender Pyramid
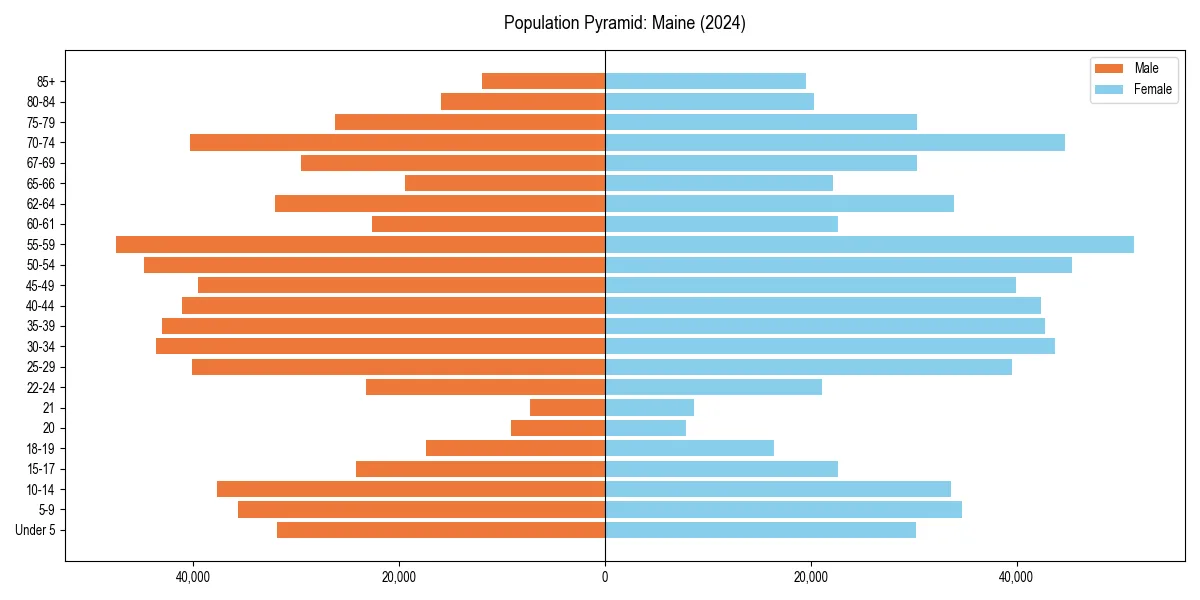
Figure 2: Population distribution by age and gender for 2024.
Maine Historical Population Data
| Year | Median Age | Population |
|---|---|---|
| 2024 | 44.8 | 1,387,817 |
| 2023 | 44.8 | 1,377,400 |
| 2022 | 44.8 | 1,366,949 |
| 2021 | 44.7 | 1,357,046 |
| 2020 | 44.8 | 1,340,825 |
| 2019 | 44.7 | 1,335,492 |
| 2018 | 44.6 | 1,332,813 |
| 2017 | 44.3 | 1,330,158 |
| 2016 | 44.0 | 1,329,923 |
| 2015 | 43.8 | 1,329,100 |
| 2014 | 43.5 | 1,328,535 |
| 2013 | 43.2 | 1,328,320 |
| 2012 | 42.8 | 1,329,084 |
| 2011 | 42.4 | 1,328,543 |
| 2010 | 42.0 | 1,327,665 |
Maine Age Group Breakdown (2024)
| Age Cohort | Percentage |
|---|---|
| Under 5 | 4.5% |
| 5–17 | 13.6% |
| 18–24 | 8.0% |
| 25–34 | 12.0% |
| 35–54 | 24.4% |
| 55–64 | 15.1% |
| 65+ | 22.4% |
Dependency Ratios for Maine
- Total Dependency Ratio:
- 67.8
- Youth Dependency:
- 30.3
- Old-Age Dependency:
- 37.5
The dependency ratio measures dependents (ages 0-17 and 65+) per 100 working-age individuals (ages 18-64).
Age & Gender FAQs for Maine
The median age in Maine is 44.8 years.
According to latest Census data, the total population of Maine is 1,387,817.
In Maine, seniors (ages 65+) make up 22.4% of the population, while children under 18 represent 13.6%.
Based on historical data since 2010, the population in Maine is aging.