Cumberland County, Maine Nativity & Citizenship Status (2024)
Place of birth and citizenship status analysis for Cumberland County, Maine
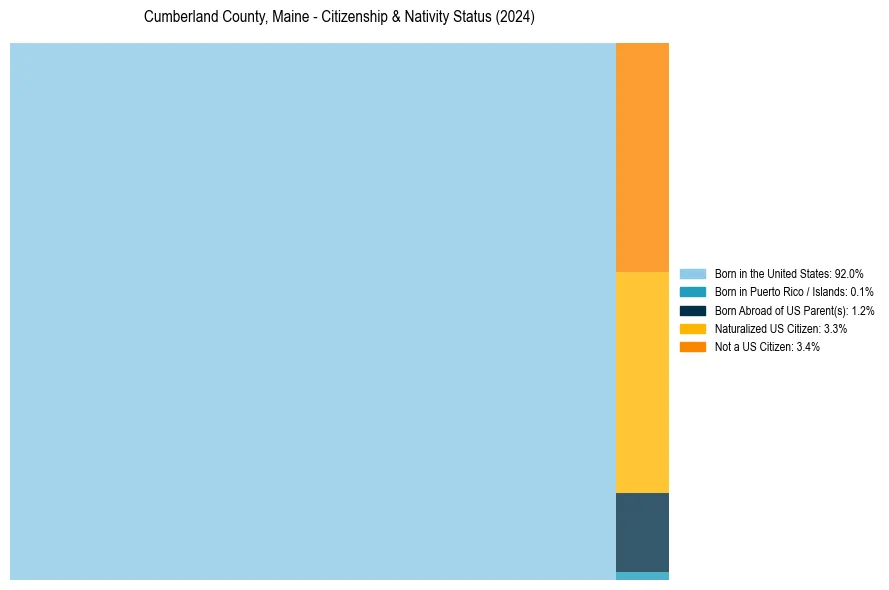
Cumberland County, Maine Nativity & Citizenship Indicators (2024)
Native Born
93.3%
Foreign Born
6.7%
Naturalized
3.3%
US Citizens
96.6%
Cumberland County, Maine Nativity & Citizenship Distribution
Cumberland County, Maine Historical Nativity Trends (2010–2024)
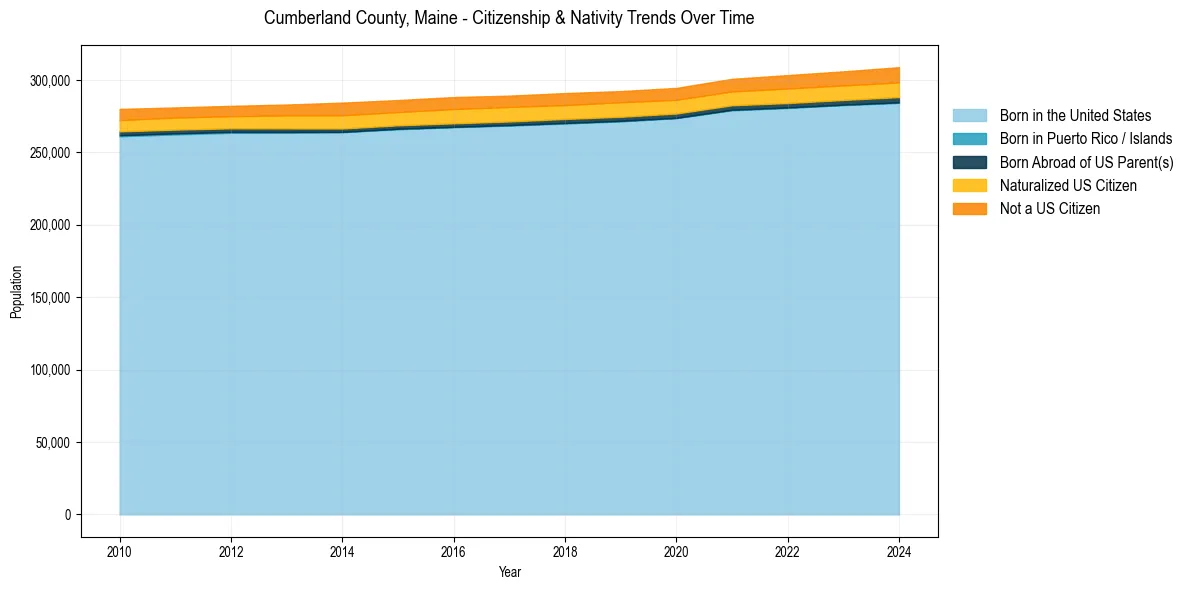
Cumberland County, Maine Population & Nativity History
| Year | Total Pop | Foreign Born | Native Born |
|---|---|---|---|
| 2024 | 308,827 | 6.7% | 93.3% |
| 2023 | 305,940 | 6.5% | 93.5% |
| 2022 | 303,357 | 6.4% | 93.6% |
| 2021 | 300,776 | 6.1% | 93.9% |
| 2020 | 294,520 | 6.0% | 94.0% |
| 2019 | 292,307 | 6.1% | 93.9% |
| 2018 | 290,944 | 6.1% | 93.9% |
| 2017 | 289,173 | 6.2% | 93.8% |
| 2016 | 288,204 | 6.3% | 93.7% |
| 2015 | 286,119 | 6.1% | 93.9% |
| 2014 | 284,351 | 6.3% | 93.7% |
| 2013 | 283,046 | 5.8% | 94.2% |
| 2012 | 282,143 | 5.5% | 94.5% |
| 2011 | 281,044 | 5.5% | 94.5% |
| 2010 | 279,994 | 5.5% | 94.5% |
Nativity & Citizenship FAQs for Cumberland County, Maine
Approximately 6.7% of residents in Cumberland County, Maine were born outside the United States.
The vast majority of residents, roughly 96.6%, are U.S. citizens (including both native-born and naturalized citizens).