Maine Nativity & Citizenship Status (2024)
Place of birth and citizenship status analysis for Maine
Maine Nativity & Citizenship Indicators (2024)
Native Born
95.9%
Foreign Born
4.1%
Naturalized
2.1%
US Citizens
98.1%
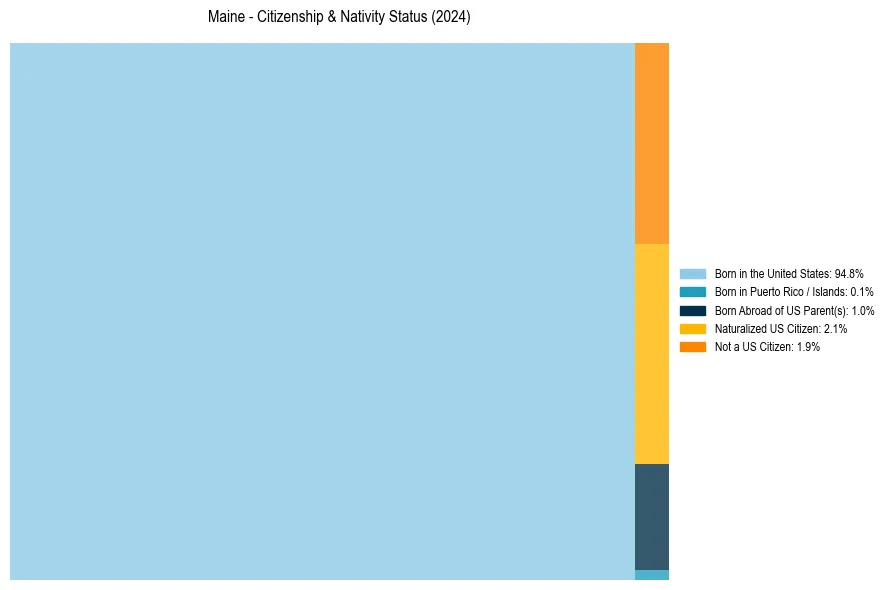
Maine Nativity & Citizenship Distribution
Maine Historical Nativity Trends (2010–2024)
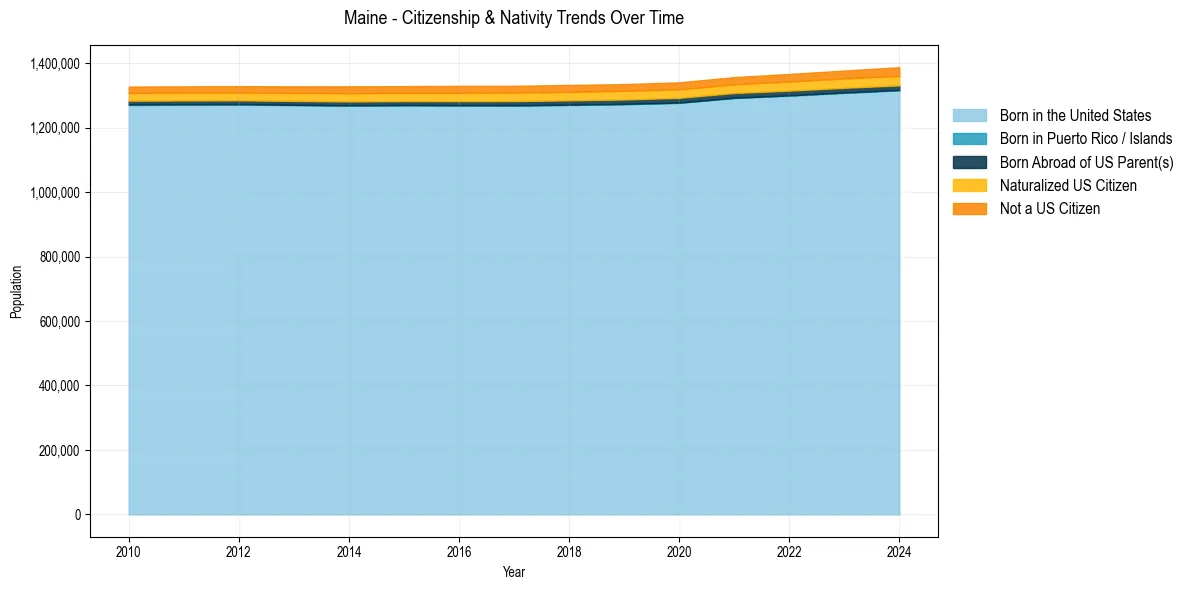
Maine Population & Nativity History
| Year | Total Pop | Foreign Born | Native Born |
|---|---|---|---|
| 2024 | 1,387,817 | 4.1% | 95.9% |
| 2023 | 1,377,400 | 3.9% | 96.1% |
| 2022 | 1,366,949 | 3.8% | 96.2% |
| 2021 | 1,357,046 | 3.6% | 96.4% |
| 2020 | 1,340,825 | 3.6% | 96.4% |
| 2019 | 1,335,492 | 3.6% | 96.4% |
| 2018 | 1,332,813 | 3.6% | 96.4% |
| 2017 | 1,330,158 | 3.6% | 96.4% |
| 2016 | 1,329,923 | 3.6% | 96.4% |
| 2015 | 1,329,100 | 3.5% | 96.5% |
| 2014 | 1,328,535 | 3.5% | 96.5% |
| 2013 | 1,328,320 | 3.4% | 96.6% |
| 2012 | 1,329,084 | 3.3% | 96.7% |
| 2011 | 1,328,543 | 3.3% | 96.7% |
| 2010 | 1,327,665 | 3.3% | 96.7% |
Nativity & Citizenship FAQs for Maine
Approximately 4.1% of residents in Maine were born outside the United States.
The vast majority of residents, roughly 98.1%, are U.S. citizens (including both native-born and naturalized citizens).