Queen Anne's County, Maryland Nativity & Citizenship Status (2024)
Place of birth and citizenship status analysis for Queen Anne's County, Maryland
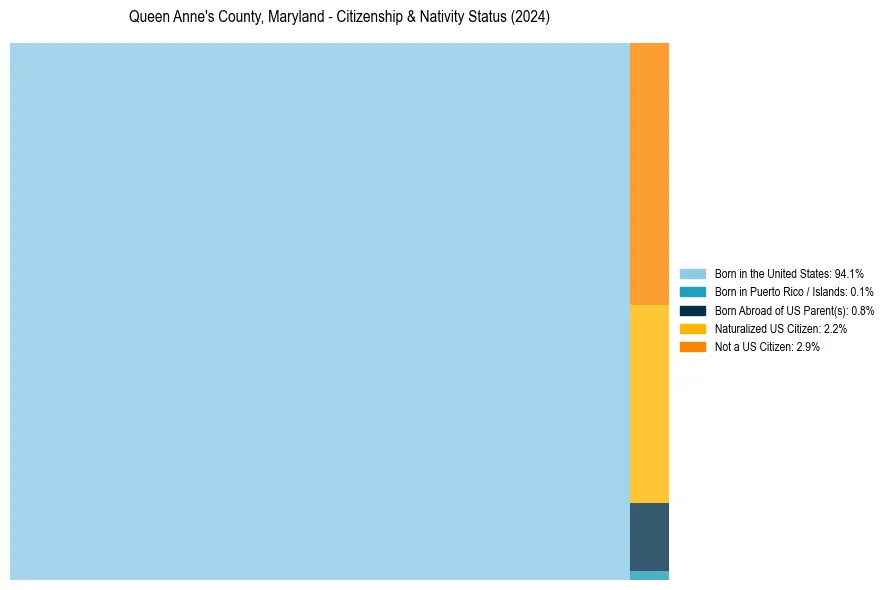
Queen Anne's County, Maryland Nativity & Citizenship Indicators (2024)
Native Born
94.9%
Foreign Born
5.1%
Naturalized
2.2%
US Citizens
97.1%
Queen Anne's County, Maryland Nativity & Citizenship Distribution
Queen Anne's County, Maryland Historical Nativity Trends (2010–2024)
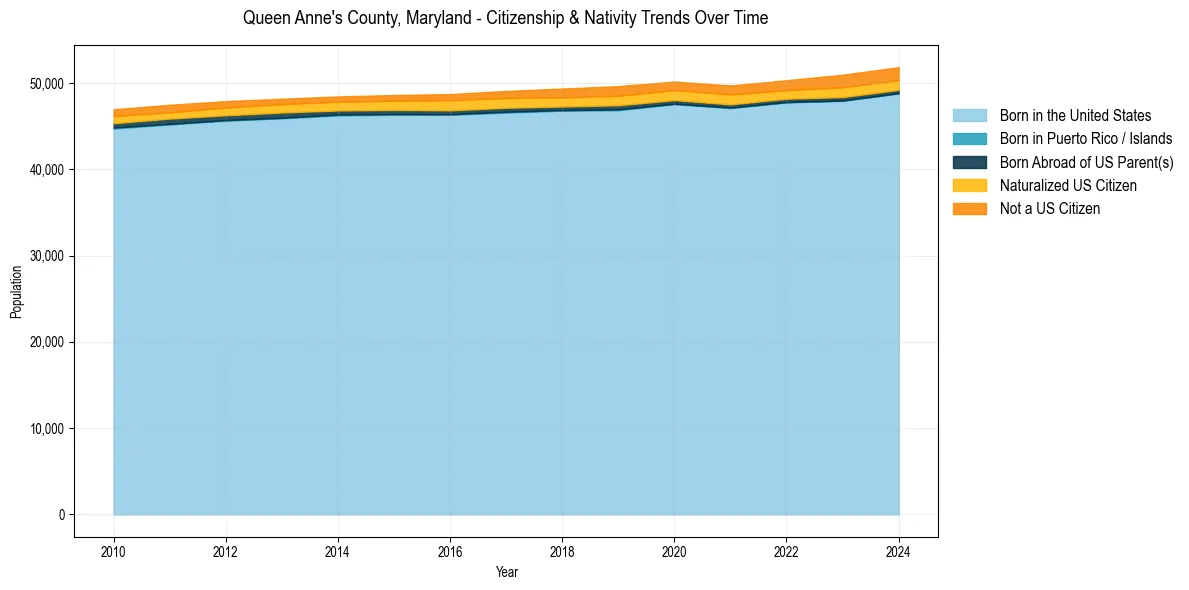
Queen Anne's County, Maryland Population & Nativity History
| Year | Total Pop | Foreign Born | Native Born |
|---|---|---|---|
| 2024 | 51,825 | 5.1% | 94.9% |
| 2023 | 50,951 | 5.1% | 94.9% |
| 2022 | 50,316 | 4.3% | 95.7% |
| 2021 | 49,702 | 4.4% | 95.6% |
| 2020 | 50,163 | 4.3% | 95.7% |
| 2019 | 49,632 | 4.5% | 95.5% |
| 2018 | 49,355 | 4.2% | 95.8% |
| 2017 | 49,071 | 4.0% | 96.0% |
| 2016 | 48,712 | 3.9% | 96.1% |
| 2015 | 48,600 | 3.6% | 96.4% |
| 2014 | 48,439 | 3.4% | 96.6% |
| 2013 | 48,166 | 3.3% | 96.7% |
| 2012 | 47,894 | 3.4% | 96.6% |
| 2011 | 47,468 | 3.4% | 96.6% |
| 2010 | 46,945 | 3.4% | 96.6% |
Nativity & Citizenship FAQs for Queen Anne's County, Maryland
Approximately 5.1% of residents in Queen Anne's County, Maryland were born outside the United States.
The vast majority of residents, roughly 97.1%, are U.S. citizens (including both native-born and naturalized citizens).