Maryland Race & Ethnicity Demographics (2024)
Racial distribution and diversity statistics for Maryland
Maryland Diversity Indicators (2024)
Total Population
6,206,011
Diversity Score
67.7
Diversity Tier
High
Largest Group
White (Non-Hispanic)
46.6%%
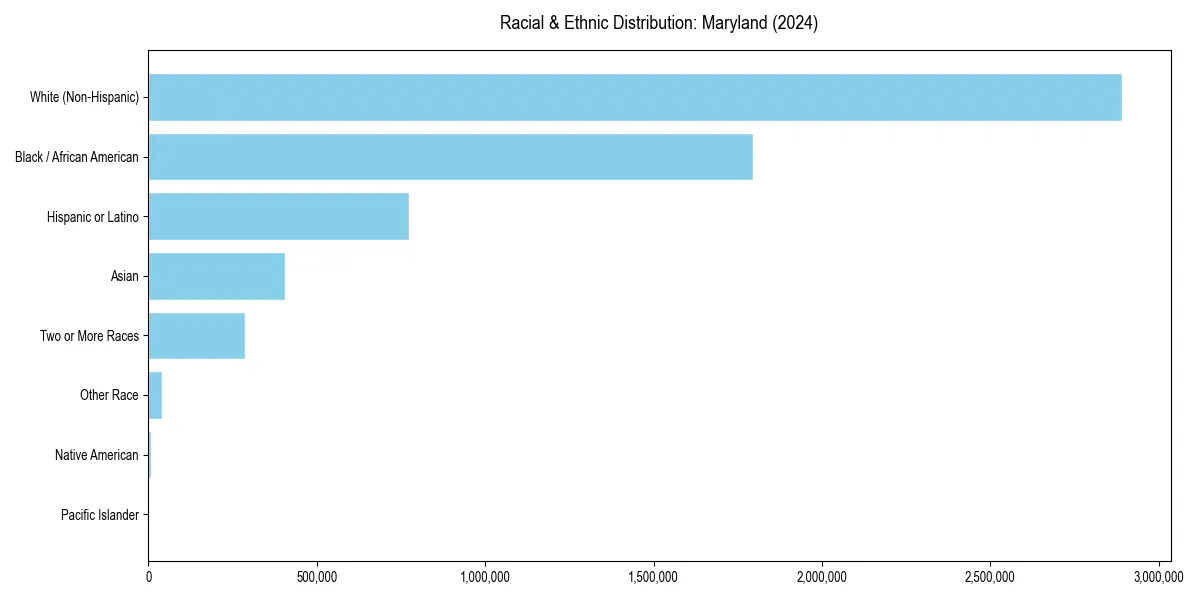
Maryland Racial & Ethnic Breakdown
Maryland Historical Diversity Trend (2010–2024)
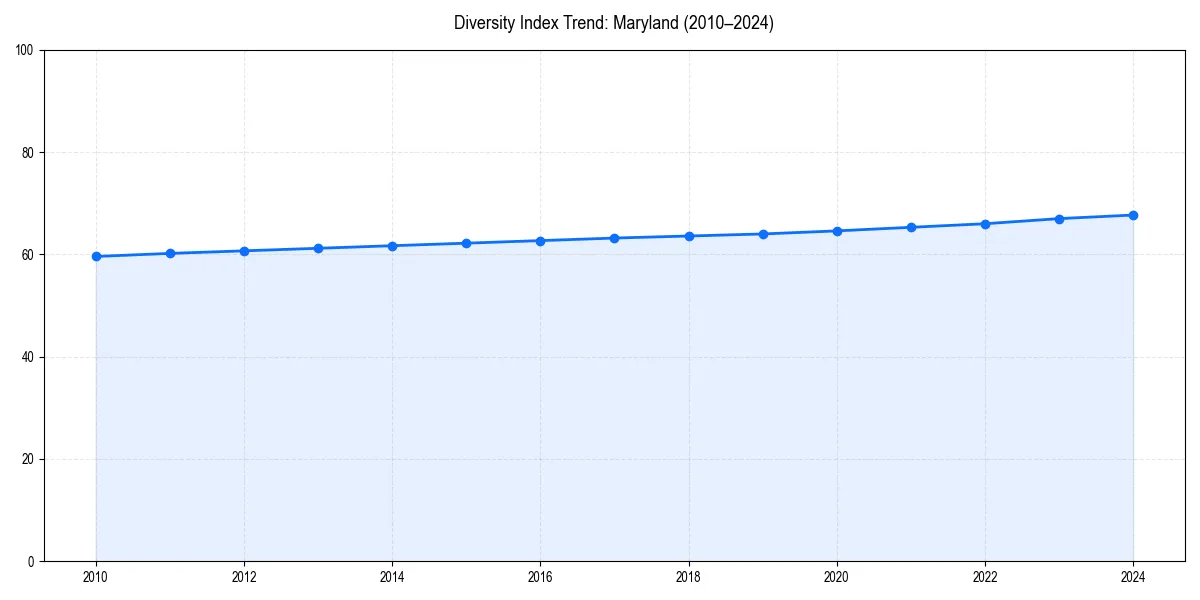
Since 2010, the diversity index of Maryland has increased significantly.
Maryland Population by Race & Ethnicity
| Race / Ethnicity | Population | Percentage |
|---|---|---|
| White (Non-Hispanic) | 2,890,956 | 46.6% |
| Black / African American | 1,796,433 | 28.9% |
| Hispanic or Latino | 774,946 | 12.5% |
| Asian | 406,030 | 6.5% |
| Two or More Races | 287,249 | 4.6% |
| Other Race | 41,380 | 0.7% |
| Native American | 6,943 | 0.1% |
| Pacific Islander | 2,074 | 0.0% |
Diversity & Demographics FAQs for Maryland
The largest racial or ethnic group in Maryland is White (Non-Hispanic), which makes up 46.6% of the total population.
Since 2010, the diversity index for Maryland has increased significantly. The area currently has a diversity score of 67.7/100, which is considered a High level of diversity.