St. Mary's County, Maryland Nativity & Citizenship Status (2024)
Place of birth and citizenship status analysis for St. Mary's County, Maryland
St. Mary's County, Maryland Nativity & Citizenship Indicators (2024)
Native Born
95.7%
Foreign Born
4.3%
Naturalized
2.5%
US Citizens
98.2%
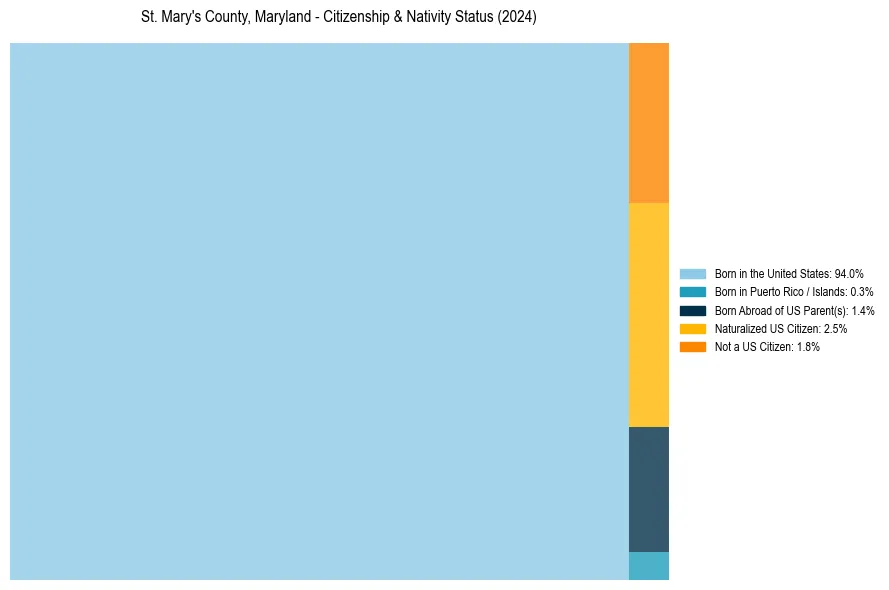
St. Mary's County, Maryland Nativity & Citizenship Distribution
St. Mary's County, Maryland Historical Nativity Trends (2010–2024)
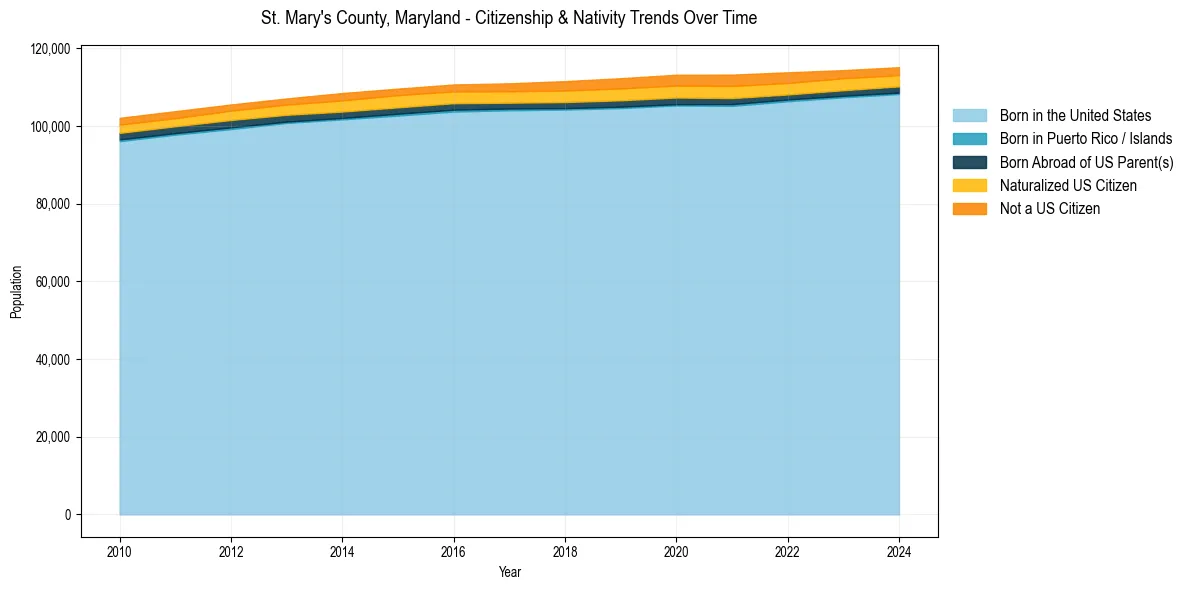
St. Mary's County, Maryland Population & Nativity History
| Year | Total Pop | Foreign Born | Native Born |
|---|---|---|---|
| 2024 | 115,126 | 4.3% | 95.7% |
| 2023 | 114,372 | 4.5% | 95.5% |
| 2022 | 113,814 | 5.0% | 95.0% |
| 2021 | 113,209 | 5.3% | 94.7% |
| 2020 | 113,182 | 5.2% | 94.8% |
| 2019 | 112,290 | 5.1% | 94.9% |
| 2018 | 111,531 | 4.8% | 95.2% |
| 2017 | 110,979 | 4.5% | 95.5% |
| 2016 | 110,675 | 4.4% | 95.6% |
| 2015 | 109,614 | 4.4% | 95.6% |
| 2014 | 108,472 | 4.4% | 95.6% |
| 2013 | 107,079 | 3.9% | 96.1% |
| 2012 | 105,528 | 3.8% | 96.2% |
| 2011 | 103,805 | 3.7% | 96.3% |
| 2010 | 102,086 | 3.8% | 96.2% |
Nativity & Citizenship FAQs for St. Mary's County, Maryland
Approximately 4.3% of residents in St. Mary's County, Maryland were born outside the United States.
The vast majority of residents, roughly 98.2%, are U.S. citizens (including both native-born and naturalized citizens).