Massachusetts Age & Gender Distribution (2024)
Population distribution by age and gender for Massachusetts
Massachusetts Age & Gender Statistics (2024)
Total Population
7,044,056
Median Age
40.0
Male Median
38.9
Female Median
41.1
Massachusetts Population Growth
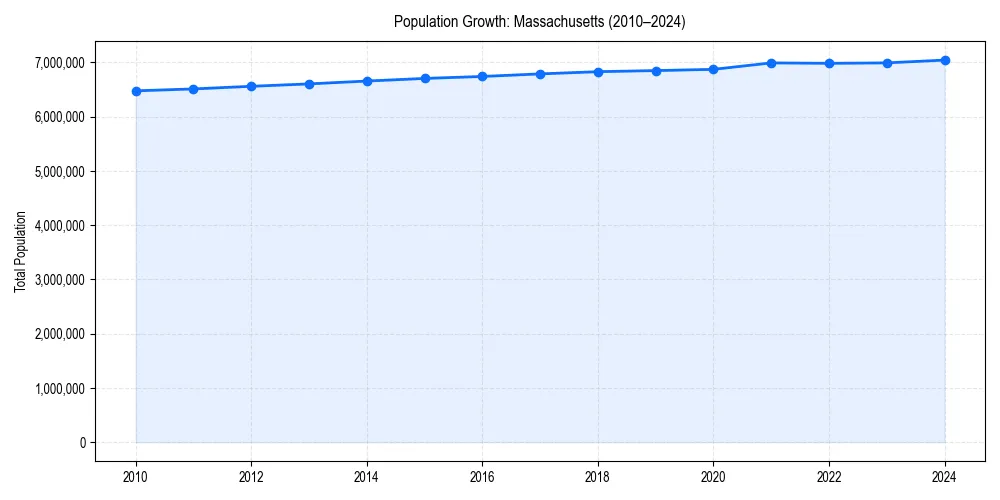
Massachusetts Demographic Trend
Since 2010, the population of has changed by +8.8%%.
+8.8%% Growth
Massachusetts Age & Gender Pyramid
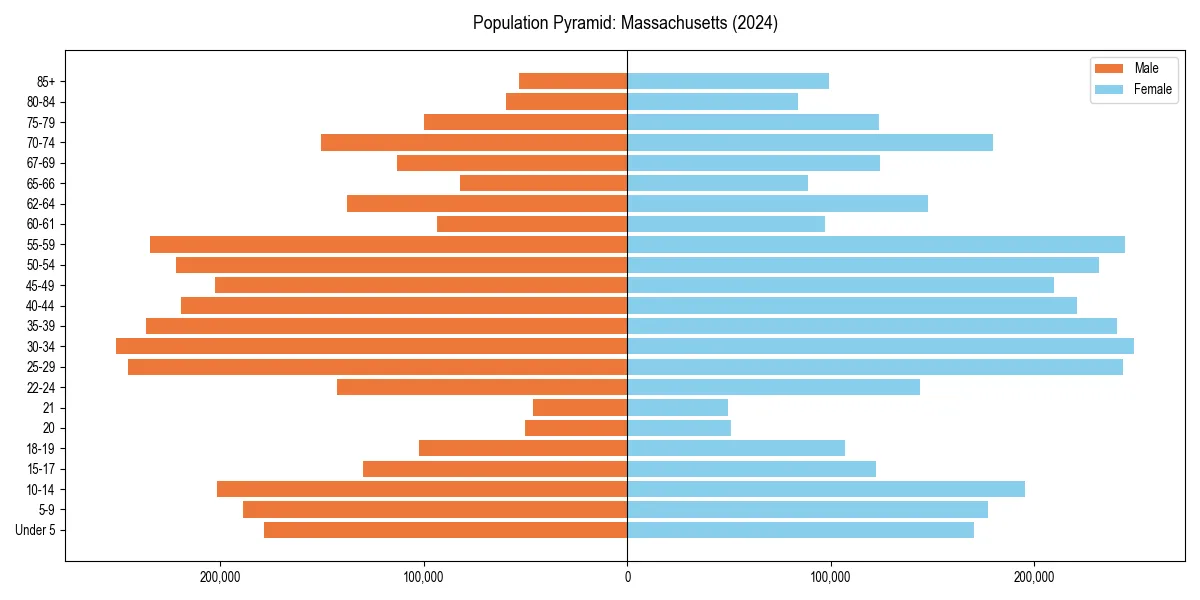
Figure 2: Population distribution by age and gender for 2024.
Massachusetts Historical Population Data
| Year | Median Age | Population |
|---|---|---|
| 2024 | 40.0 | 7,044,056 |
| 2023 | 40.0 | 6,992,395 |
| 2022 | 39.8 | 6,984,205 |
| 2021 | 39.6 | 6,991,852 |
| 2020 | 39.6 | 6,873,003 |
| 2019 | 39.5 | 6,850,553 |
| 2018 | 39.4 | 6,830,193 |
| 2017 | 39.4 | 6,789,319 |
| 2016 | 39.4 | 6,742,143 |
| 2015 | 39.3 | 6,705,586 |
| 2014 | 39.3 | 6,657,291 |
| 2013 | 39.2 | 6,605,058 |
| 2012 | 39.1 | 6,560,595 |
| 2011 | 38.9 | 6,512,227 |
| 2010 | 38.7 | 6,477,096 |
Massachusetts Age Group Breakdown (2024)
| Age Cohort | Percentage |
|---|---|
| Under 5 | 5.0% |
| 5–17 | 14.4% |
| 18–24 | 9.8% |
| 25–34 | 14.0% |
| 35–54 | 25.3% |
| 55–64 | 13.6% |
| 65+ | 17.9% |
Dependency Ratios for Massachusetts
- Total Dependency Ratio:
- 59.3
- Youth Dependency:
- 30.9
- Old-Age Dependency:
- 28.5
The dependency ratio measures dependents (ages 0-17 and 65+) per 100 working-age individuals (ages 18-64).
Age & Gender FAQs for Massachusetts
The median age in Massachusetts is 40.0 years.
According to latest Census data, the total population of Massachusetts is 7,044,056.
In Massachusetts, seniors (ages 65+) make up 17.9% of the population, while children under 18 represent 14.4%.
Based on historical data since 2010, the population in Massachusetts has remained stable.