Michigan Age & Gender Distribution (2024)
Population distribution by age and gender for Michigan
Michigan Age & Gender Statistics (2024)
Total Population
10,077,761
Median Age
40.2
Male Median
39.0
Female Median
41.3
Michigan Population Growth
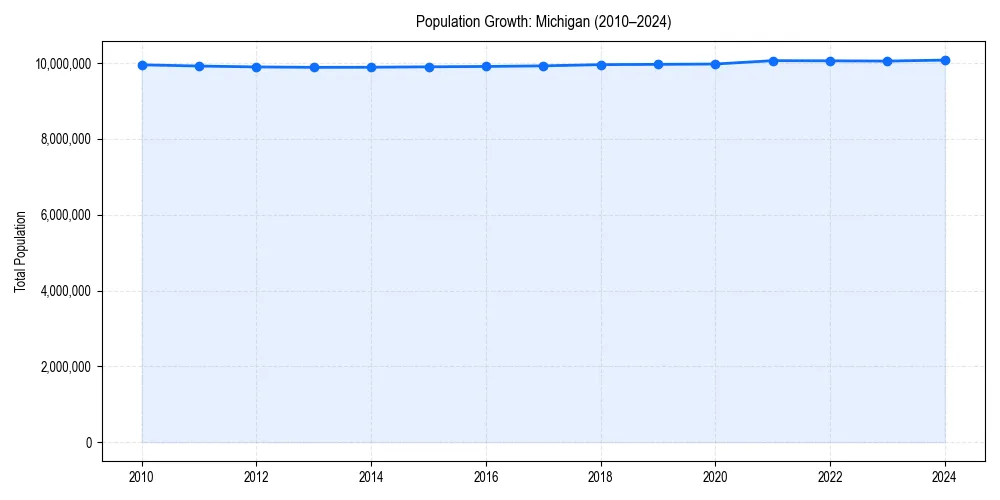
Michigan Demographic Trend
Since 2010, the population of has changed by +1.3%%.
+1.3%% Growth
Michigan Age & Gender Pyramid
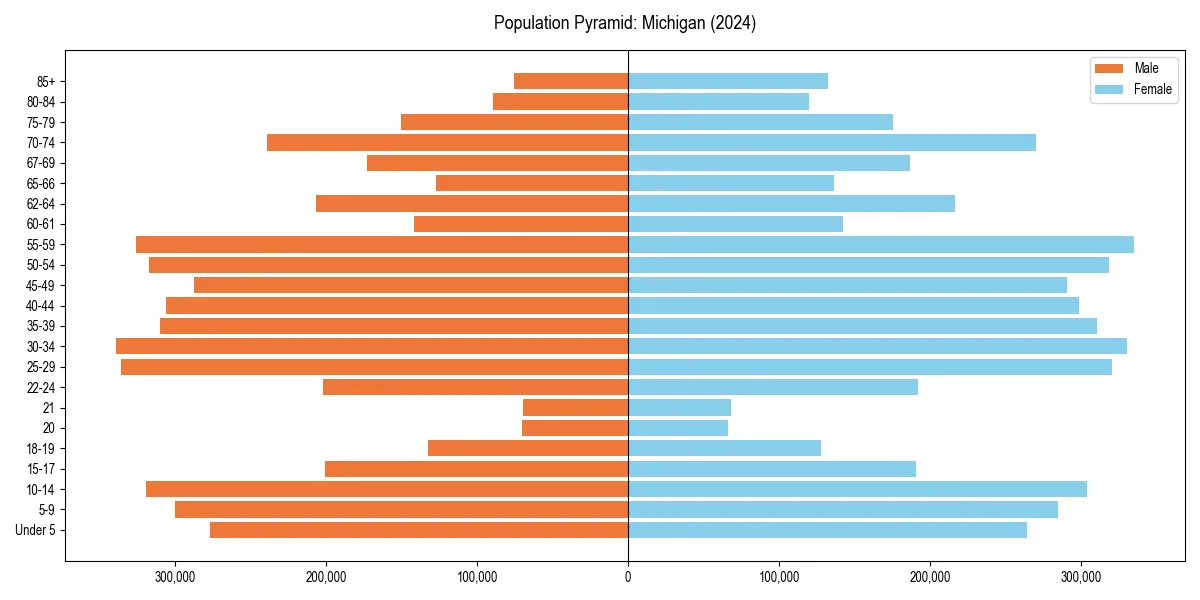
Figure 2: Population distribution by age and gender for 2024.
Michigan Historical Population Data
| Year | Median Age | Population |
|---|---|---|
| 2024 | 40.2 | 10,077,761 |
| 2023 | 40.1 | 10,051,595 |
| 2022 | 39.9 | 10,057,921 |
| 2021 | 39.8 | 10,062,512 |
| 2020 | 39.8 | 9,973,907 |
| 2019 | 39.7 | 9,965,265 |
| 2018 | 39.7 | 9,957,488 |
| 2017 | 39.6 | 9,925,568 |
| 2016 | 39.5 | 9,909,600 |
| 2015 | 39.5 | 9,900,571 |
| 2014 | 39.3 | 9,889,024 |
| 2013 | 39.1 | 9,886,095 |
| 2012 | 38.8 | 9,897,264 |
| 2011 | 38.5 | 9,920,621 |
| 2010 | 38.1 | 9,952,687 |
Michigan Age Group Breakdown (2024)
| Age Cohort | Percentage |
|---|---|
| Under 5 | 5.4% |
| 5–17 | 15.9% |
| 18–24 | 9.2% |
| 25–34 | 13.2% |
| 35–54 | 24.2% |
| 55–64 | 13.6% |
| 65+ | 18.6% |
Dependency Ratios for Michigan
- Total Dependency Ratio:
- 66.3
- Youth Dependency:
- 35.3
- Old-Age Dependency:
- 31.0
The dependency ratio measures dependents (ages 0-17 and 65+) per 100 working-age individuals (ages 18-64).
Age & Gender FAQs for Michigan
The median age in Michigan is 40.2 years.
According to latest Census data, the total population of Michigan is 10,077,761.
In Michigan, seniors (ages 65+) make up 18.6% of the population, while children under 18 represent 15.9%.
Based on historical data since 2010, the population in Michigan is aging.