Minnesota Age & Gender Distribution (2024)
Population distribution by age and gender for Minnesota
Minnesota Age & Gender Statistics (2024)
Total Population
5,739,445
Median Age
38.8
Male Median
38.1
Female Median
39.5
Minnesota Population Growth
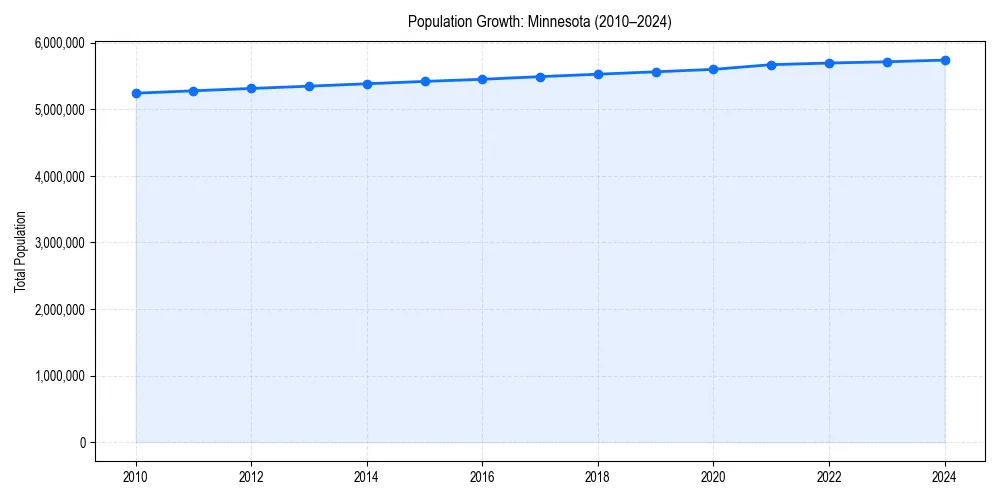
Minnesota Demographic Trend
Since 2010, the population of has changed by +9.5%%.
+9.5%% Growth
Minnesota Age & Gender Pyramid
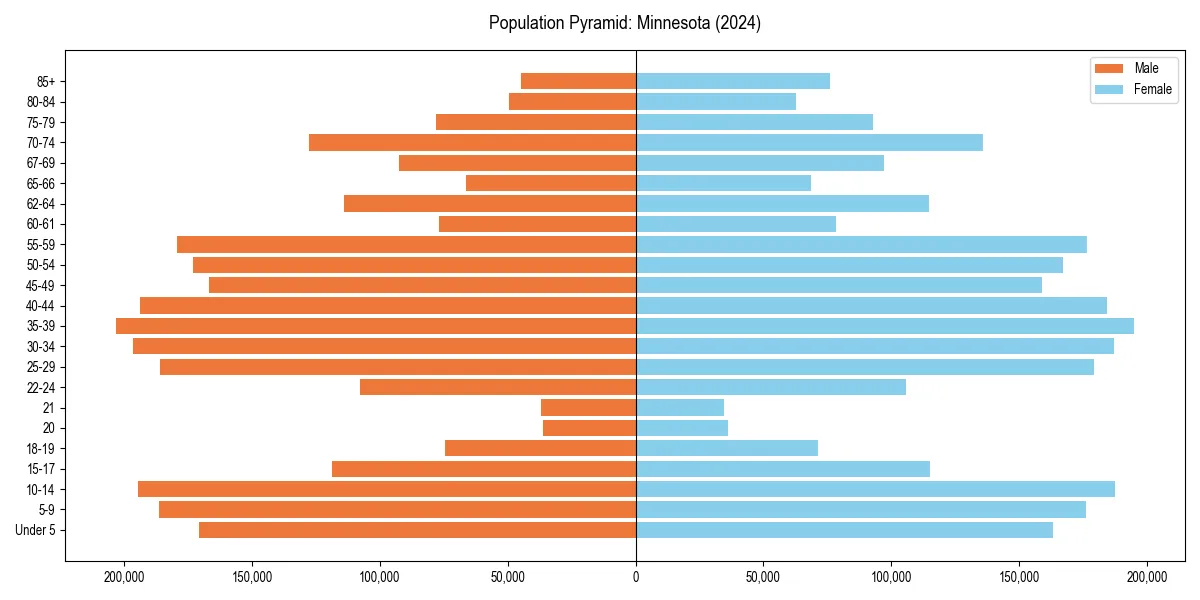
Figure 2: Population distribution by age and gender for 2024.
Minnesota Historical Population Data
| Year | Median Age | Population |
|---|---|---|
| 2024 | 38.8 | 5,739,445 |
| 2023 | 38.6 | 5,713,716 |
| 2022 | 38.5 | 5,695,292 |
| 2021 | 38.2 | 5,670,472 |
| 2020 | 38.1 | 5,600,166 |
| 2019 | 38.0 | 5,563,378 |
| 2018 | 37.9 | 5,527,358 |
| 2017 | 37.9 | 5,490,726 |
| 2016 | 37.8 | 5,450,868 |
| 2015 | 37.7 | 5,419,171 |
| 2014 | 37.6 | 5,383,661 |
| 2013 | 37.6 | 5,347,740 |
| 2012 | 37.4 | 5,313,081 |
| 2011 | 37.3 | 5,278,190 |
| 2010 | 37.1 | 5,241,914 |
Minnesota Age Group Breakdown (2024)
| Age Cohort | Percentage |
|---|---|
| Under 5 | 5.8% |
| 5–17 | 17.0% |
| 18–24 | 8.8% |
| 25–34 | 13.0% |
| 35–54 | 25.1% |
| 55–64 | 12.9% |
| 65+ | 17.3% |
Dependency Ratios for Minnesota
- Total Dependency Ratio:
- 67.1
- Youth Dependency:
- 38.2
- Old-Age Dependency:
- 28.9
The dependency ratio measures dependents (ages 0-17 and 65+) per 100 working-age individuals (ages 18-64).
Age & Gender FAQs for Minnesota
The median age in Minnesota is 38.8 years.
According to latest Census data, the total population of Minnesota is 5,739,445.
In Minnesota, seniors (ages 65+) make up 17.3% of the population, while children under 18 represent 17.0%.
Based on historical data since 2010, the population in Minnesota is aging.