Mississippi Age & Gender Distribution (2024)
Population distribution by age and gender for Mississippi
Mississippi Age & Gender Statistics (2024)
Total Population
2,946,779
Median Age
38.6
Male Median
37.1
Female Median
39.9
Mississippi Population Growth
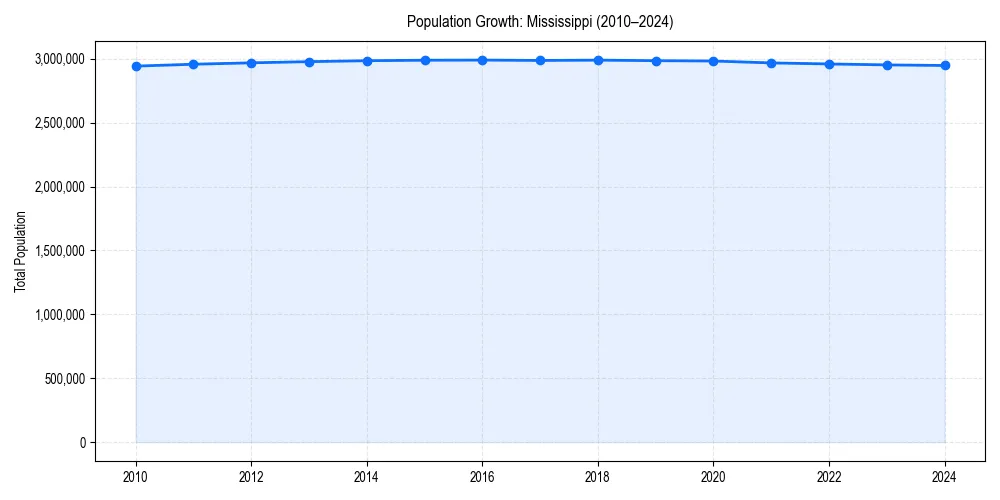
Mississippi Demographic Trend
Since 2010, the population of has changed by +0.2%%.
+0.2%% Growth
Mississippi Age & Gender Pyramid
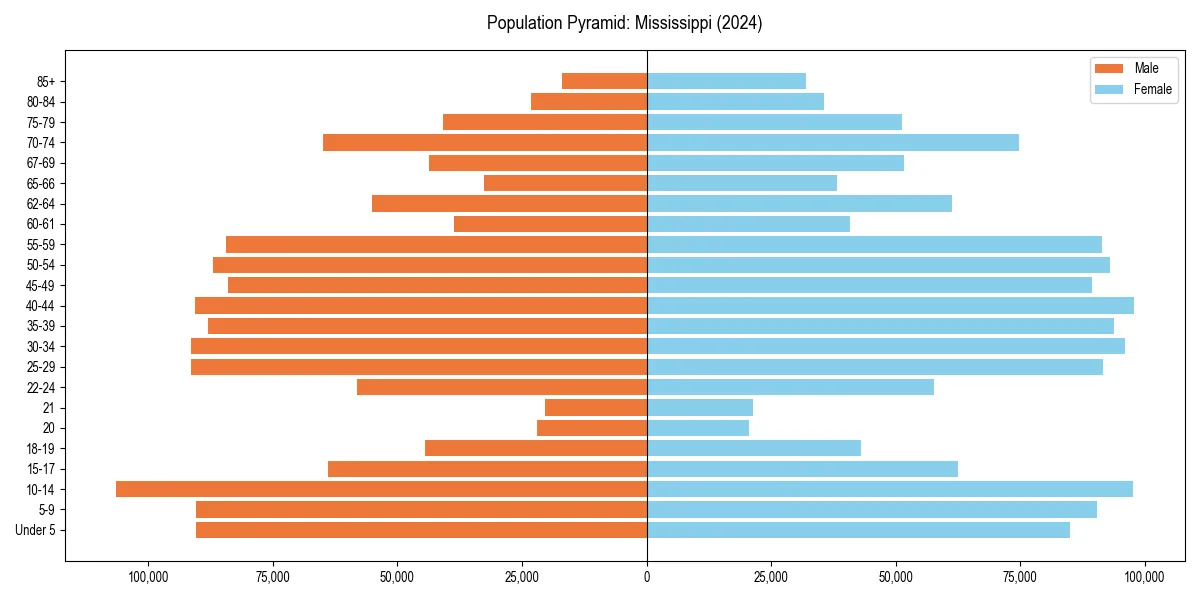
Figure 2: Population distribution by age and gender for 2024.
Mississippi Historical Population Data
| Year | Median Age | Population |
|---|---|---|
| 2024 | 38.6 | 2,946,779 |
| 2023 | 38.4 | 2,951,438 |
| 2022 | 38.1 | 2,958,846 |
| 2021 | 37.8 | 2,967,023 |
| 2020 | 37.7 | 2,981,835 |
| 2019 | 37.5 | 2,984,418 |
| 2018 | 37.2 | 2,988,762 |
| 2017 | 36.9 | 2,986,220 |
| 2016 | 36.7 | 2,989,192 |
| 2015 | 36.5 | 2,988,081 |
| 2014 | 36.3 | 2,984,345 |
| 2013 | 36.2 | 2,976,872 |
| 2012 | 36.0 | 2,967,620 |
| 2011 | 35.9 | 2,956,700 |
| 2010 | 35.8 | 2,941,991 |
Mississippi Age Group Breakdown (2024)
| Age Cohort | Percentage |
|---|---|
| Under 5 | 6.0% |
| 5–17 | 17.4% |
| 18–24 | 9.8% |
| 25–34 | 12.6% |
| 35–54 | 24.6% |
| 55–64 | 12.6% |
| 65+ | 17.2% |
Dependency Ratios for Mississippi
- Total Dependency Ratio:
- 68.0
- Youth Dependency:
- 39.2
- Old-Age Dependency:
- 28.8
The dependency ratio measures dependents (ages 0-17 and 65+) per 100 working-age individuals (ages 18-64).
Age & Gender FAQs for Mississippi
The median age in Mississippi is 38.6 years.
According to latest Census data, the total population of Mississippi is 2,946,779.
In Mississippi, seniors (ages 65+) make up 17.2% of the population, while children under 18 represent 17.4%.
Based on historical data since 2010, the population in Mississippi is aging.