Missouri Age & Gender Distribution (2024)
Population distribution by age and gender for Missouri
Missouri Age & Gender Statistics (2024)
Total Population
6,191,814
Median Age
39.0
Male Median
37.9
Female Median
40.2
Missouri Population Growth
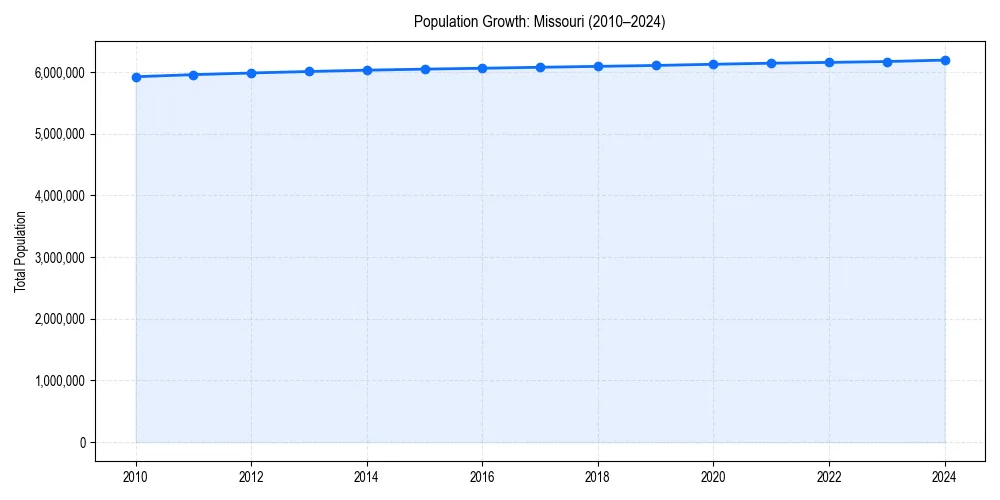
Missouri Demographic Trend
Since 2010, the population of has changed by +4.6%%.
+4.6%% Growth
Missouri Age & Gender Pyramid
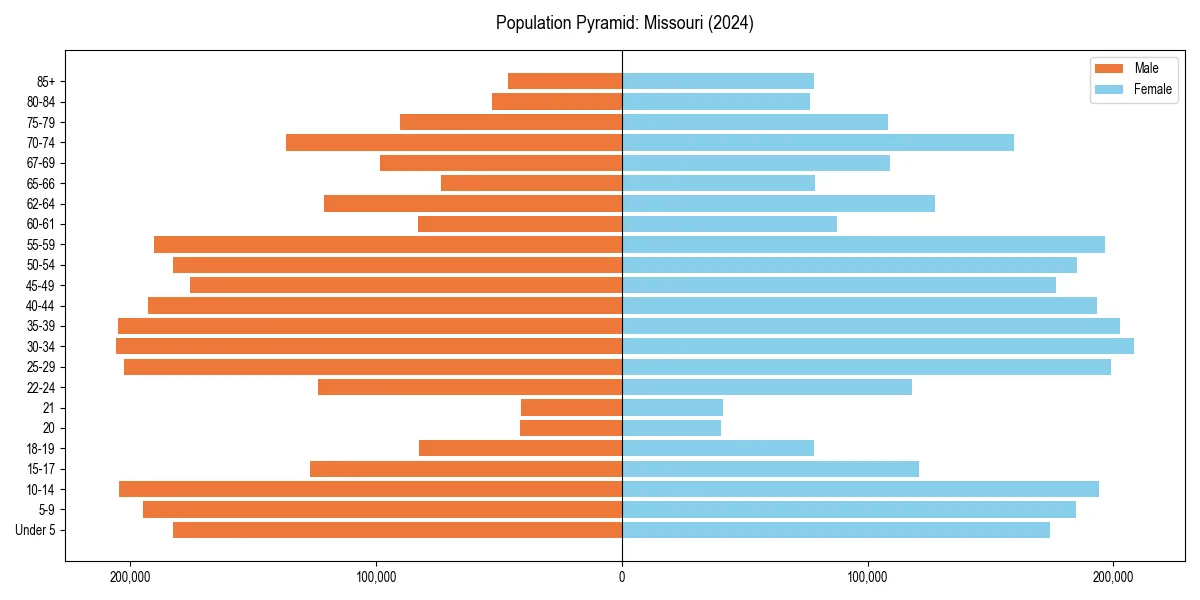
Figure 2: Population distribution by age and gender for 2024.
Missouri Historical Population Data
| Year | Median Age | Population |
|---|---|---|
| 2024 | 39.0 | 6,191,814 |
| 2023 | 38.9 | 6,168,181 |
| 2022 | 38.8 | 6,154,422 |
| 2021 | 38.8 | 6,141,534 |
| 2020 | 38.7 | 6,124,160 |
| 2019 | 38.6 | 6,104,910 |
| 2018 | 38.5 | 6,090,062 |
| 2017 | 38.4 | 6,075,300 |
| 2016 | 38.3 | 6,059,651 |
| 2015 | 38.2 | 6,045,448 |
| 2014 | 38.1 | 6,028,076 |
| 2013 | 38.0 | 6,007,182 |
| 2012 | 37.9 | 5,982,413 |
| 2011 | 37.7 | 5,955,802 |
| 2010 | 37.6 | 5,922,314 |
Missouri Age Group Breakdown (2024)
| Age Cohort | Percentage |
|---|---|
| Under 5 | 5.8% |
| 5–17 | 16.6% |
| 18–24 | 9.1% |
| 25–34 | 13.2% |
| 35–54 | 24.5% |
| 55–64 | 13.0% |
| 65+ | 17.9% |
Dependency Ratios for Missouri
- Total Dependency Ratio:
- 67.3
- Youth Dependency:
- 37.4
- Old-Age Dependency:
- 29.9
The dependency ratio measures dependents (ages 0-17 and 65+) per 100 working-age individuals (ages 18-64).
Age & Gender FAQs for Missouri
The median age in Missouri is 39.0 years.
According to latest Census data, the total population of Missouri is 6,191,814.
In Missouri, seniors (ages 65+) make up 17.9% of the population, while children under 18 represent 16.6%.
Based on historical data since 2010, the population in Missouri has remained stable.