Daniels County, Montana Nativity & Citizenship Status (2024)
Place of birth and citizenship status analysis for Daniels County, Montana
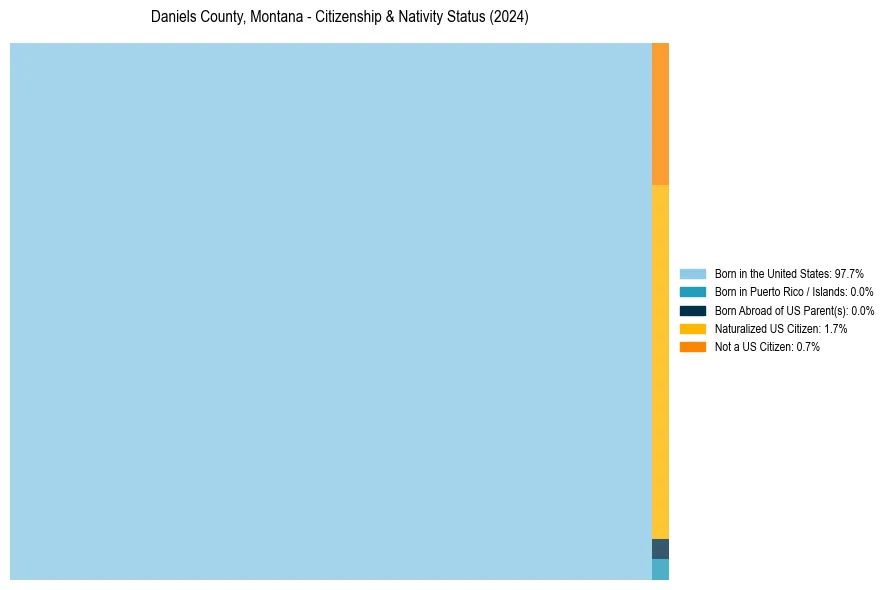
Daniels County, Montana Nativity & Citizenship Indicators (2024)
Native Born
97.7%
Foreign Born
2.3%
Naturalized
1.7%
US Citizens
99.3%
Daniels County, Montana Nativity & Citizenship Distribution
Daniels County, Montana Historical Nativity Trends (2010–2024)
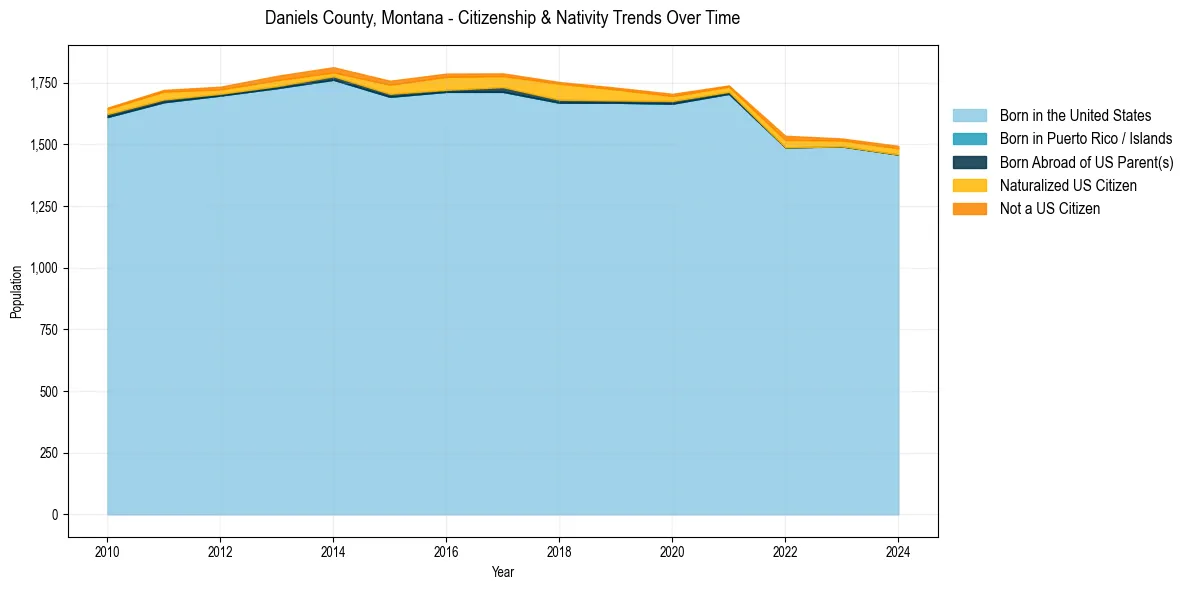
Daniels County, Montana Population & Nativity History
| Year | Total Pop | Foreign Born | Native Born |
|---|---|---|---|
| 2024 | 1,494 | 2.3% | 97.7% |
| 2023 | 1,524 | 2.1% | 97.9% |
| 2022 | 1,535 | 3.1% | 96.9% |
| 2021 | 1,739 | 1.5% | 98.5% |
| 2020 | 1,705 | 1.7% | 98.3% |
| 2019 | 1,730 | 3.0% | 97.0% |
| 2018 | 1,753 | 4.1% | 95.9% |
| 2017 | 1,788 | 3.1% | 96.9% |
| 2016 | 1,787 | 3.7% | 96.3% |
| 2015 | 1,758 | 3.0% | 97.0% |
| 2014 | 1,813 | 2.0% | 98.0% |
| 2013 | 1,778 | 2.4% | 97.6% |
| 2012 | 1,734 | 1.7% | 98.3% |
| 2011 | 1,721 | 2.3% | 97.7% |
| 2010 | 1,649 | 1.6% | 98.4% |
Nativity & Citizenship FAQs for Daniels County, Montana
Approximately 2.3% of residents in Daniels County, Montana were born outside the United States.
The vast majority of residents, roughly 99.3%, are U.S. citizens (including both native-born and naturalized citizens).