Flathead County, Montana Nativity & Citizenship Status (2024)
Place of birth and citizenship status analysis for Flathead County, Montana
Flathead County, Montana Nativity & Citizenship Indicators (2024)
Native Born
97.2%
Foreign Born
2.8%
Naturalized
1.7%
US Citizens
98.9%
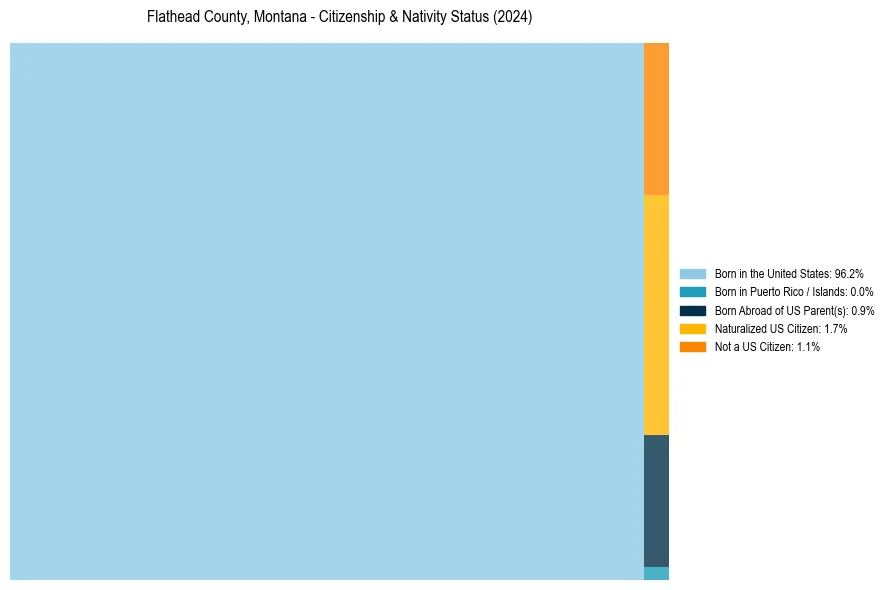
Flathead County, Montana Nativity & Citizenship Distribution
Flathead County, Montana Historical Nativity Trends (2010–2024)
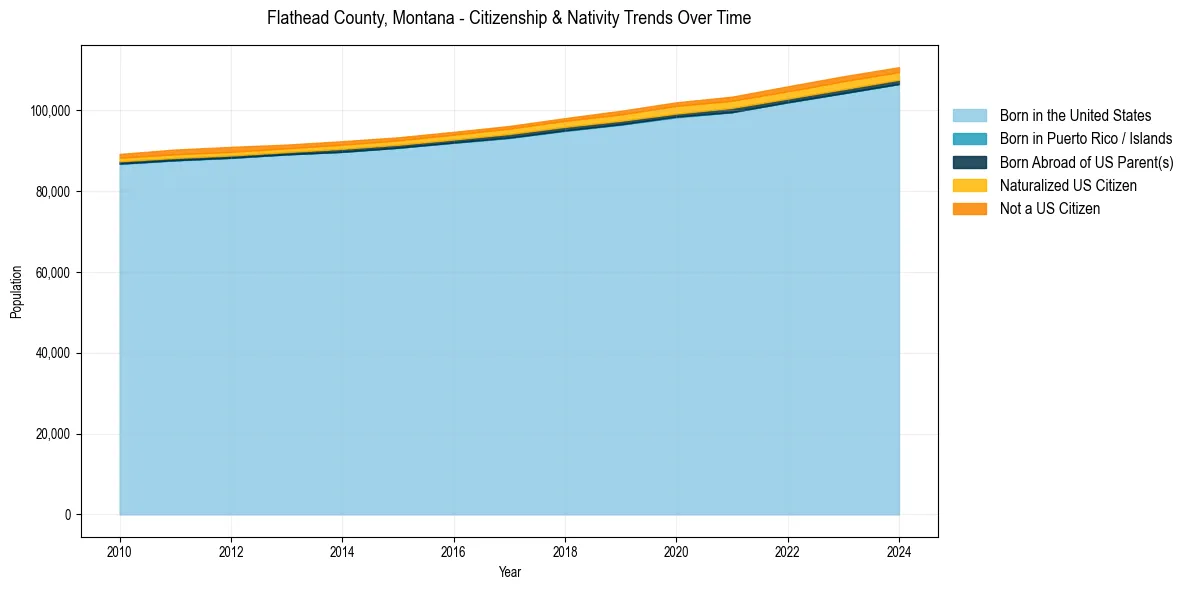
Flathead County, Montana Population & Nativity History
| Year | Total Pop | Foreign Born | Native Born |
|---|---|---|---|
| 2024 | 110,695 | 2.8% | 97.2% |
| 2023 | 108,445 | 3.0% | 97.0% |
| 2022 | 105,950 | 2.9% | 97.1% |
| 2021 | 103,400 | 2.7% | 97.3% |
| 2020 | 102,001 | 2.7% | 97.3% |
| 2019 | 99,899 | 2.5% | 97.5% |
| 2018 | 98,082 | 2.2% | 97.8% |
| 2017 | 96,147 | 2.1% | 97.9% |
| 2016 | 94,696 | 2.0% | 98.0% |
| 2015 | 93,333 | 2.0% | 98.0% |
| 2014 | 92,373 | 2.0% | 98.0% |
| 2013 | 91,536 | 2.0% | 98.0% |
| 2012 | 90,967 | 2.3% | 97.7% |
| 2011 | 90,317 | 2.3% | 97.7% |
| 2010 | 89,215 | 2.0% | 98.0% |
Nativity & Citizenship FAQs for Flathead County, Montana
Approximately 2.8% of residents in Flathead County, Montana were born outside the United States.
The vast majority of residents, roughly 98.9%, are U.S. citizens (including both native-born and naturalized citizens).