Lewis and Clark County, Montana Nativity & Citizenship Status (2024)
Place of birth and citizenship status analysis for Lewis and Clark County, Montana
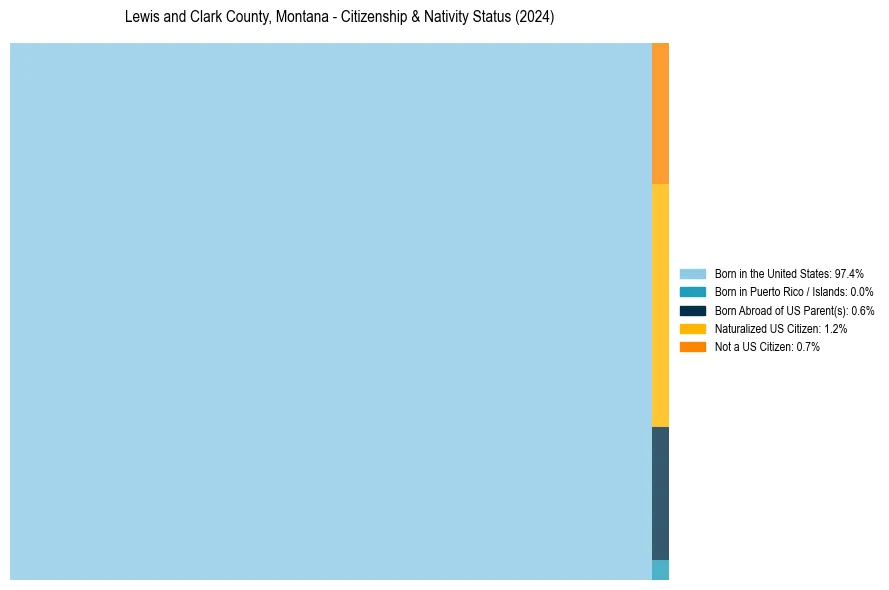
Lewis and Clark County, Montana Nativity & Citizenship Indicators (2024)
Native Born
98.1%
Foreign Born
1.9%
Naturalized
1.2%
US Citizens
99.3%
Lewis and Clark County, Montana Nativity & Citizenship Distribution
Lewis and Clark County, Montana Historical Nativity Trends (2010–2024)
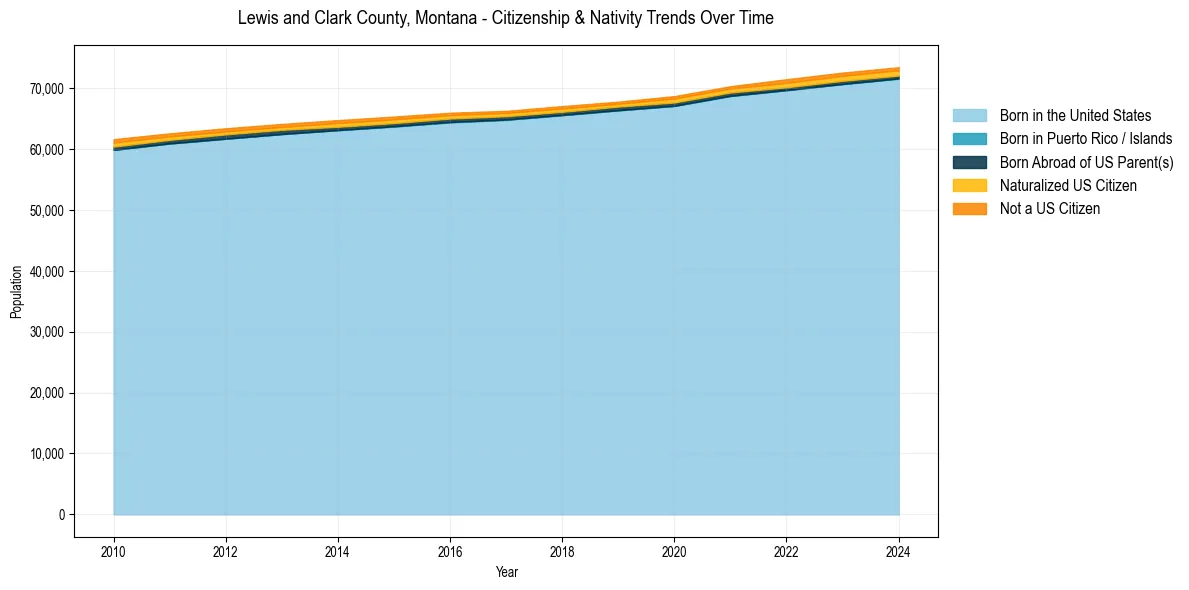
Lewis and Clark County, Montana Population & Nativity History
| Year | Total Pop | Foreign Born | Native Born |
|---|---|---|---|
| 2024 | 73,464 | 1.9% | 98.1% |
| 2023 | 72,580 | 1.9% | 98.1% |
| 2022 | 71,487 | 1.9% | 98.1% |
| 2021 | 70,340 | 1.5% | 98.5% |
| 2020 | 68,714 | 1.5% | 98.5% |
| 2019 | 67,805 | 1.2% | 98.8% |
| 2018 | 67,077 | 1.4% | 98.6% |
| 2017 | 66,290 | 1.3% | 98.7% |
| 2016 | 65,989 | 1.5% | 98.5% |
| 2015 | 65,357 | 1.6% | 98.4% |
| 2014 | 64,772 | 1.7% | 98.3% |
| 2013 | 64,143 | 1.5% | 98.5% |
| 2012 | 63,432 | 1.6% | 98.4% |
| 2011 | 62,597 | 1.7% | 98.3% |
| 2010 | 61,643 | 2.0% | 98.0% |
Nativity & Citizenship FAQs for Lewis and Clark County, Montana
Approximately 1.9% of residents in Lewis and Clark County, Montana were born outside the United States.
The vast majority of residents, roughly 99.3%, are U.S. citizens (including both native-born and naturalized citizens).