Missoula County, Montana Nativity & Citizenship Status (2024)
Place of birth and citizenship status analysis for Missoula County, Montana
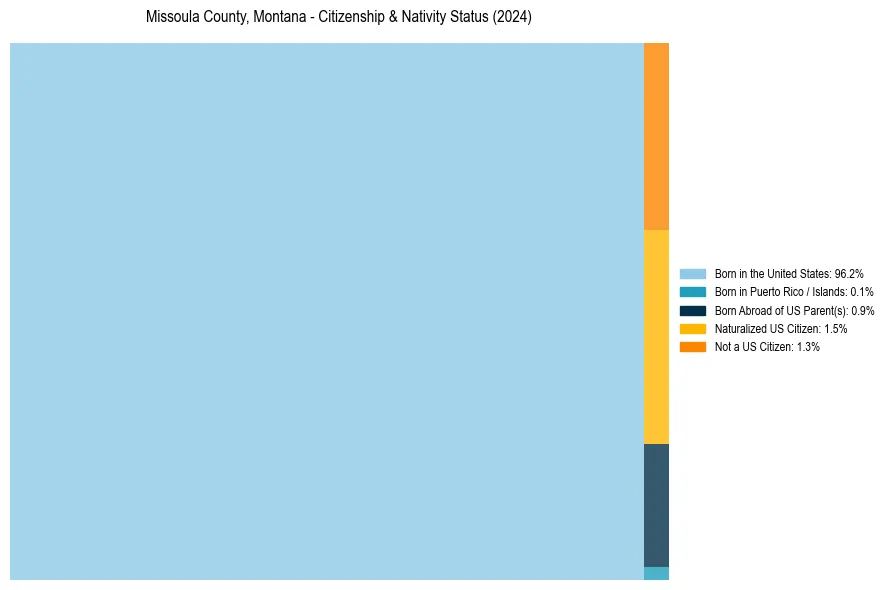
Missoula County, Montana Nativity & Citizenship Indicators (2024)
Native Born
97.1%
Foreign Born
2.9%
Naturalized
1.5%
US Citizens
98.7%
Missoula County, Montana Nativity & Citizenship Distribution
Missoula County, Montana Historical Nativity Trends (2010–2024)
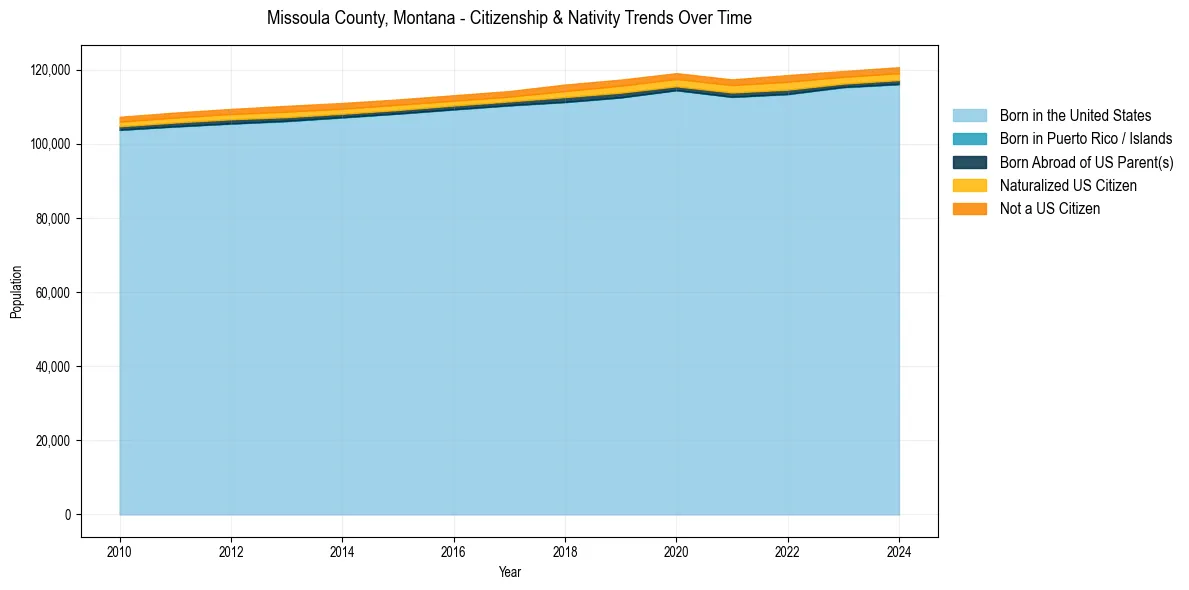
Missoula County, Montana Population & Nativity History
| Year | Total Pop | Foreign Born | Native Born |
|---|---|---|---|
| 2024 | 120,672 | 2.9% | 97.1% |
| 2023 | 119,639 | 2.8% | 97.2% |
| 2022 | 118,541 | 3.3% | 96.7% |
| 2021 | 117,379 | 3.0% | 97.0% |
| 2020 | 119,062 | 3.0% | 97.0% |
| 2019 | 117,309 | 3.0% | 97.0% |
| 2018 | 115,983 | 2.9% | 97.1% |
| 2017 | 114,231 | 2.4% | 97.6% |
| 2016 | 113,101 | 2.5% | 97.5% |
| 2015 | 111,966 | 2.5% | 97.5% |
| 2014 | 111,011 | 2.6% | 97.4% |
| 2013 | 110,243 | 2.8% | 97.2% |
| 2012 | 109,402 | 2.5% | 97.5% |
| 2011 | 108,431 | 2.5% | 97.5% |
| 2010 | 107,288 | 2.4% | 97.6% |
Nativity & Citizenship FAQs for Missoula County, Montana
Approximately 2.9% of residents in Missoula County, Montana were born outside the United States.
The vast majority of residents, roughly 98.7%, are U.S. citizens (including both native-born and naturalized citizens).